Fig. 1.
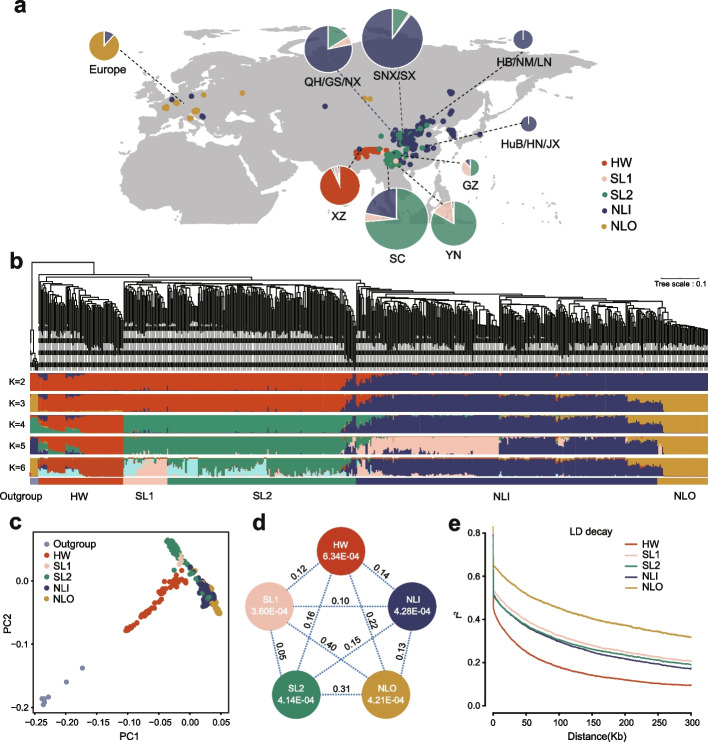
Geographic distribution, population structure and genomic diversity of Tartary buckwheat accessions. Geographic distributions of 567 Tartary buckwheat accessions. The radius of each pie represents the sample size in each region and the colors indicate the proportions of HW (Himalayan wild accession), SL1 (Southwest landrace 1), SL2 (Southwest landrace 2), NLI (Northern Landrace-Within China), NLO (Northern Landrace-Outside China). XZ, Xizang Province; SC, Sichuan Province; YN, Yunnan Province; GZ, Guizhou Province; HuB/HN/JX, Hubei/Hunan/Jiangxi Province; HB/NM/LN, Hebei/Inner Mongolia/Liaoning Province; SNX/SX, Shannxi/Shanxi Province; QH/GS/NX, Qianghai/Gansu/Ningxia Province. B The maximum-likelihood phylogeny of 567 Tartary buckwheat accessions and model-based clustering analysis with different numbers of ancestry kinship (K= 2-6). Different colors indicate different groups based on the population structure. C PCA plots of 567 Tartary buckwheat accessions and outgroup. Colors represent the membership at K = 6 (Fig. 1b). D Nucleotide diversity (π; within circles) and population divergence (FST; between circles) for the five groups (the outgroup population was not included). E Group-specific LD decay plots

