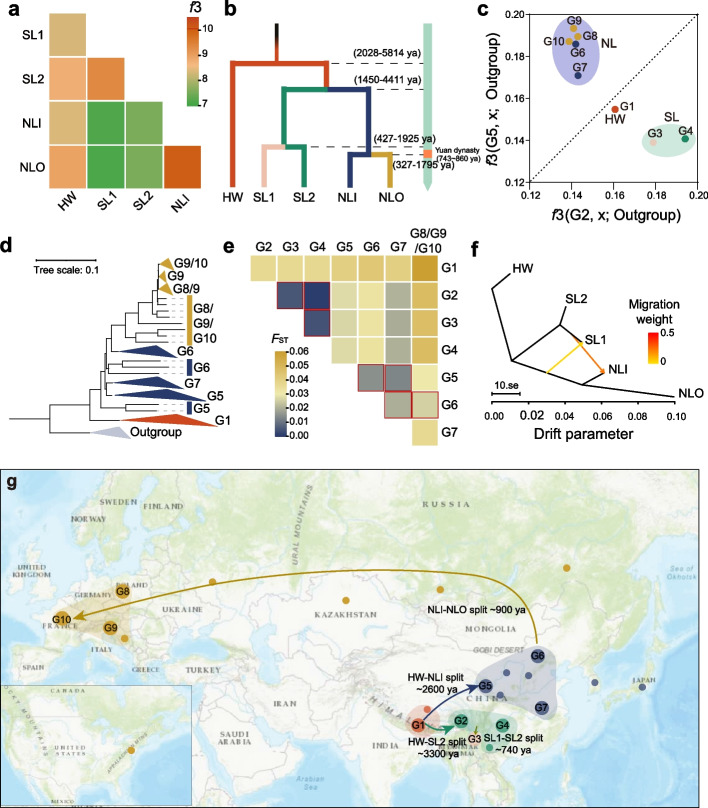
Fig. 2.
Demographic history and dispersal of Tartary buckwheat. A Heatmap showing the similarity of five population through outgroup f3 matrix. B Divergence times of the five populations. The range of predicted divergence time was shown. C Outgroup f3 statistics biplot measuring genetic similarity. Diagonal line marks the f3 statistics for G2/G5. Different groups representing accessions collected from different areas. G1, Himalayan region; G2, Sichuan; G3, Yunnan; G4, Guizhou; G5, Qinghai-Gansu; G6, Inner Mongolia-Hebei; G7, Hunan-Hubei-Jiangxi; G8, Poland; G9, Slovenia and G10, France. D Phylogenic tree of outgroup, Himalayan located group (G1), northern China located group (G5-G7) and outside China located group (G8-G10). E Pairwise fixation index (FST) of the mini-groups of Tartary buckwheat. F Gene flow between populations estimated using Treemix. Yellow and orange lines between populations indicate gene flow. G The possible spread of Tartary buckwheat from its origins in the Himalayas. Ten groups representing the population along the route are indicated. The average predicted divergent times are shown

