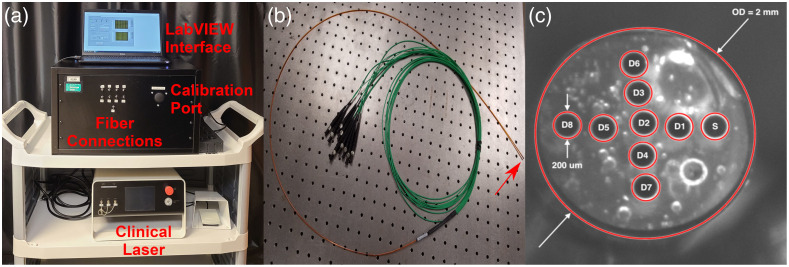
Fig. 1.
(a) Image of spectroscopy system showing fiber connections for source and detector fibers, port for integrating sphere calibration, LabVIEW interface, and the laser used for clinical PDT. (b) Image of fiber optic probe, with distal tip indicated by red arrow. (c) Image of fiber optic probe distal face showing the diameter fibers used for delivery and detection of light. The source fiber is labeled “S,” detector fibers are labeled “D,” and outside diameter is abbreviated as “OD.”

