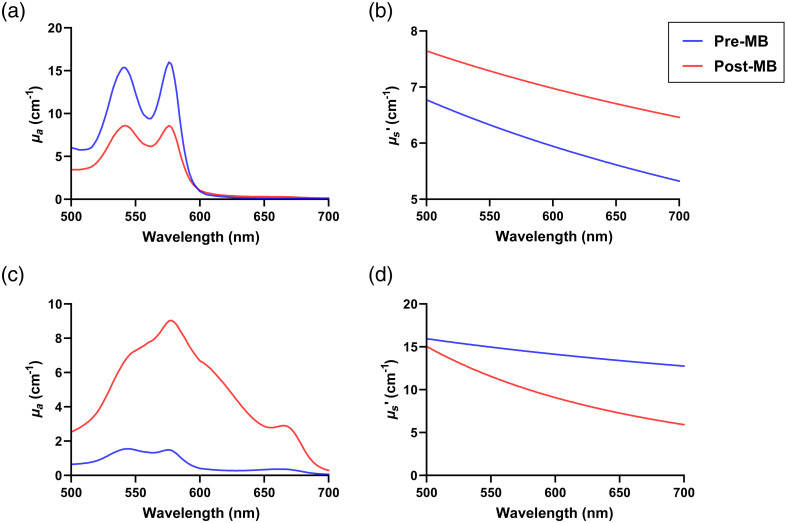
Fig. 3.
Recovered (a) absorption () and (b) reduced scattering () spectra for subject 3 shown in Figs. 2(a) and 2(b). Recovered (c) and (d) spectra for subject 8 shown in Figs. 2(c) and 2(d). Blue and red lines represent pre-MB and post-MB conditions, respectively.

