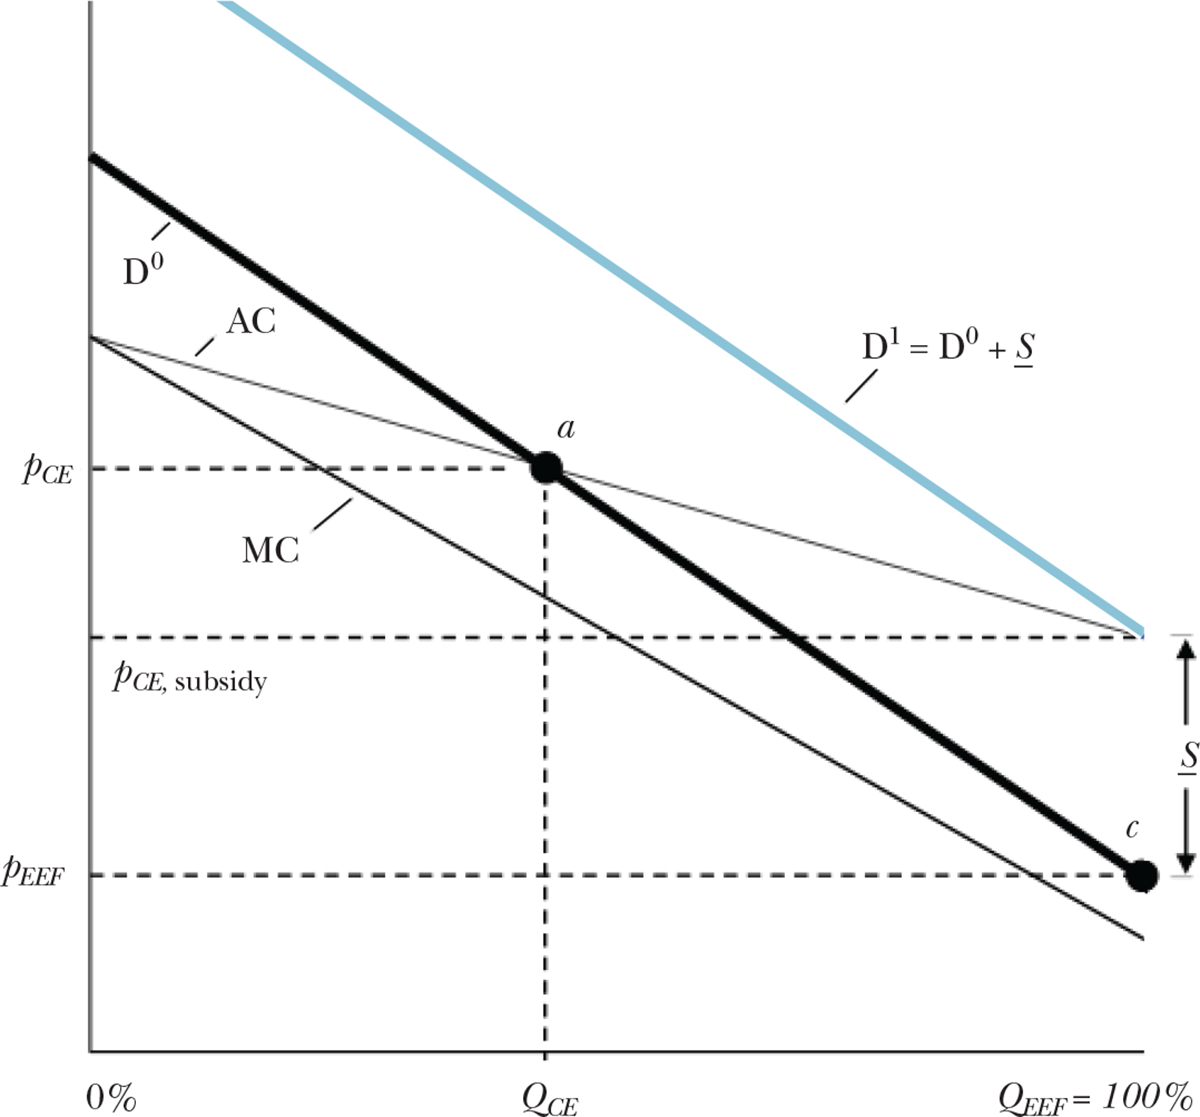
Figure 2. Subsidies/Penalties and the Fixed Contracts Price Distortion.

Notes: We follow the basic setup of Einav and Finkelstein (2011), and examine the margin of consumers choosing between taking up insurance and remaining uninsured. The horizontal axis is scaled from 0 to 100 percent enrollment. The vertical axis measures prices or costs in dollar terms. The demand curve D0 reflects the willingness-to-pay for insurance of the marginal consumer at each level of enrollment. The marginal costs of enrollees slope downward, because adverse selection implies the highest willingness-to-pay consumers are those who generate the highest costs to insure. Following the standard model, the competitive equilibrium QCE is determined by point a, the intersection of average costs and demand, where insurers earn zero profits. The efficient outcome is at point c, full enrollment, because in this example the demand curve is everywhere above the marginal cost curve. A uniform subsidy, S, equal to the difference between the rightmost point of the average cost curve and the rightmost point of the demand curve is the minimum uniform subsidy that will induce efficient sorting in this setting. If instead of a subsidy, a penalty were applied to the outside option of remaining uninsured, then S would define the minimum uniform penalty.
