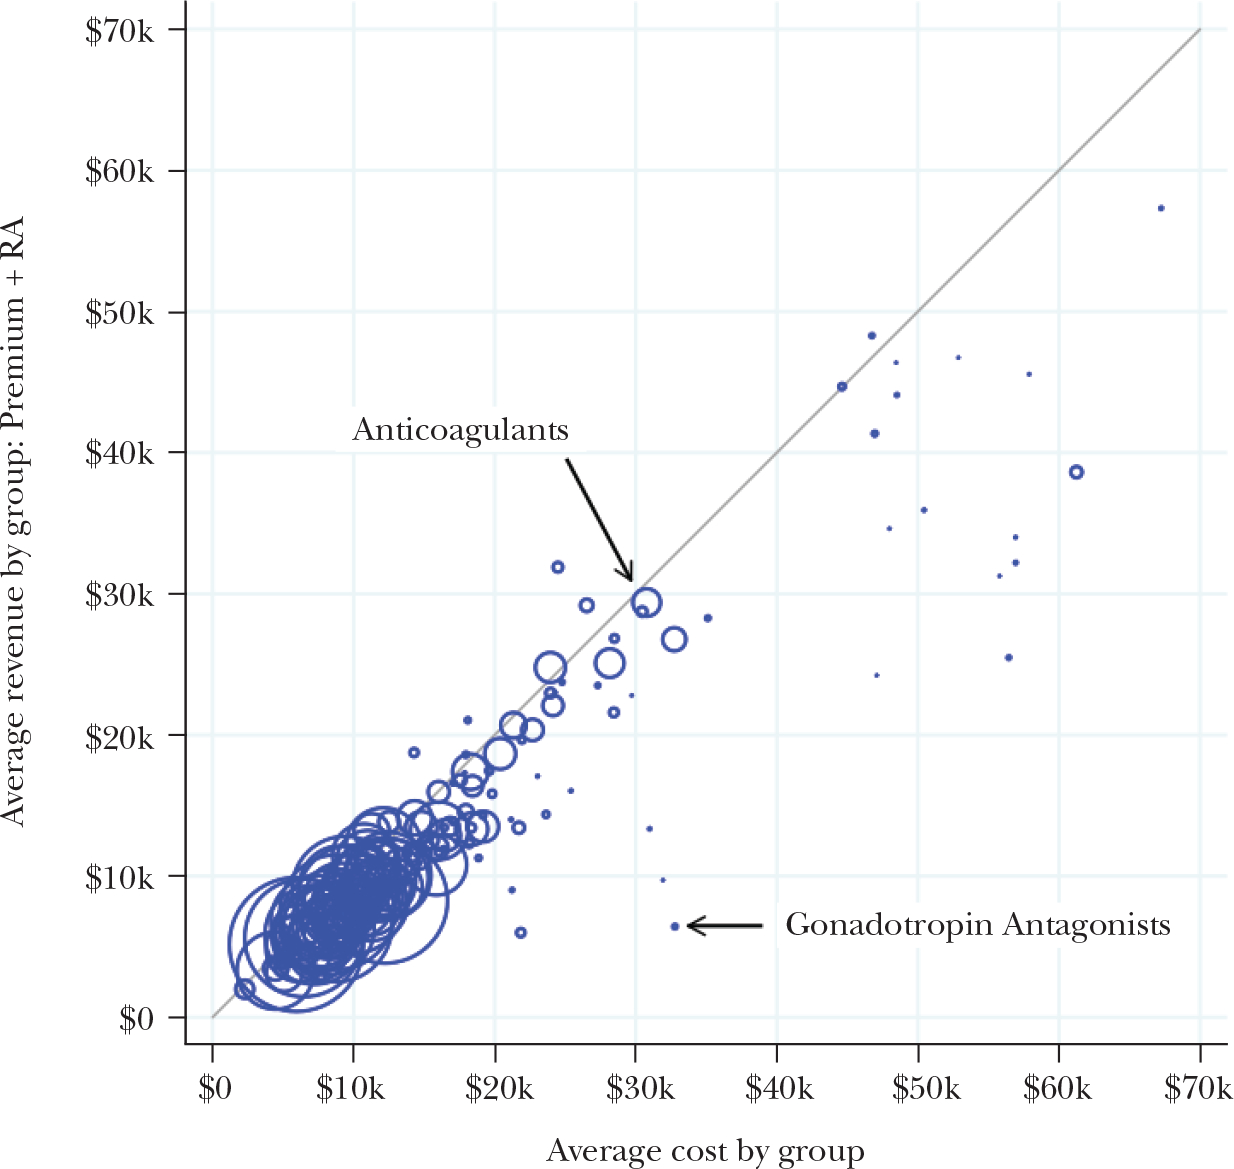
Figure 5. Incentives to Screen May Remain Net of Risk Adjustment.

Note: We classify individuals according to whether they have a pharmacy claim for a drug within one of 220 standard therapeutic classes of medications. Each circle in the figure corresponds to a therapeutic class, grouping together all consumers who used a drug in the class. Marker sizes are proportional to the numbers of consumers associated with each class. The horizontal axis measures mean total spending among consumers utilizing a drug in the class, and the vertical axis measures the mean simulated revenue (actuarially fair premiums plus risk adjustment transfers) among those same consumers. Consumers associated with classes below the 45-degree line are profitable to avoid because, for these consumers, insurer costs exceed Marketplace premium plus risk adjustment revenue in expectation. The majority of drug classes are clustered tightly around the 45-degree line, showing that the payment system succeeds in neutralizing selection incentives for the majority of potential enrollees. However there are a number of significant outliers, such as the gonadotropin class of drugs (for infertility in women).
