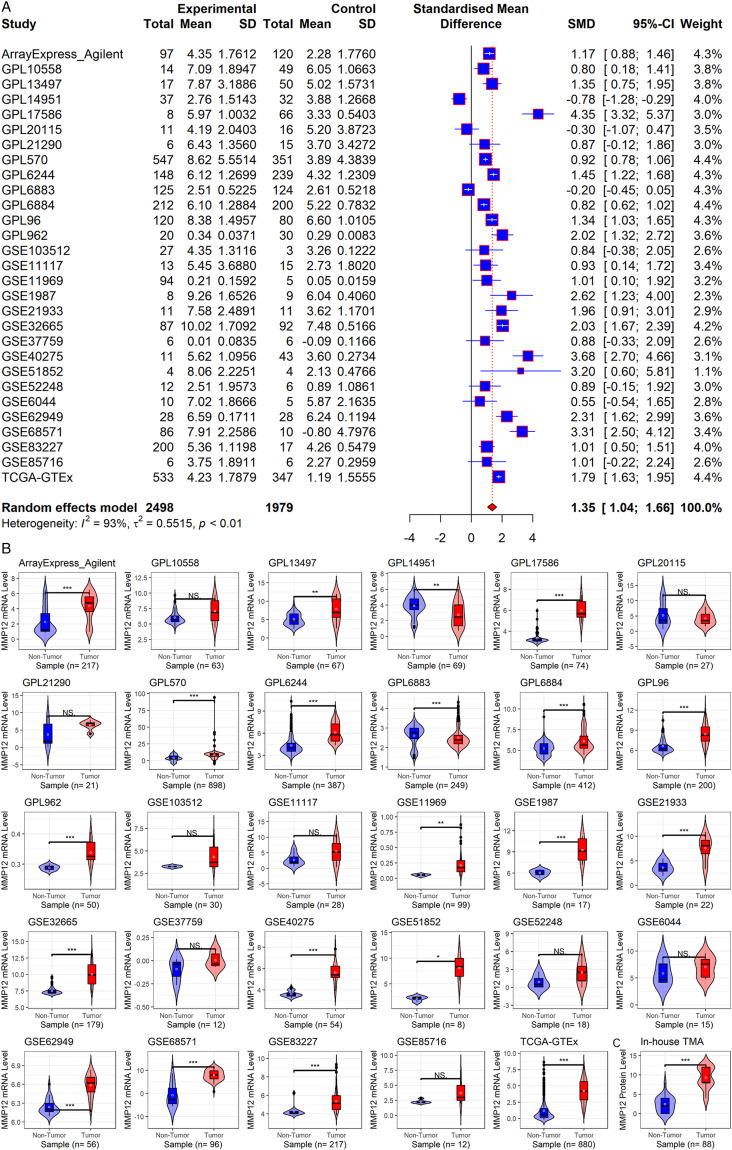
Figure 8.
MMP12 mRNA and protein levels in LUAD. Panel A: MMP12 mRNA expression forest plot in LUAD and control tissues. Panel B: Violin plots of MMP12 mRNA expression in each dataset. Panel C: The violin plot of MMP12 protein levels. The P-value is calculated based on the Wilcoxon rank-sum test. NSP ≥ .05; *P < .05; **P< .01; ***P < .001.

