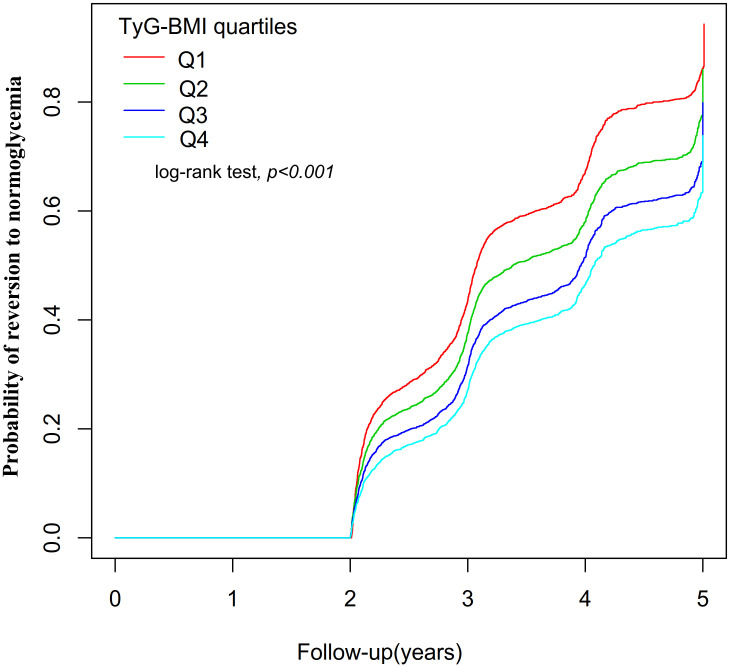
Figure 4.
showed the Kaplan-Meier curves for the likelihood of transitioning from prediabetes to normoglycemia. Displayed the Kaplan-Meier curves illustrating the probability of regression from Pre-DM to normoglycemia based on TyG-BMI quartiles. There was a significant difference in the probability of returning to normoglycemia in the different TyG-BMI quartile groups (log-rank test, P<0.001). Compared with participants in the lowest TyG-BMI quartile group (Q1), participants in the higher TyG-BMI quartile groups (Q2 to Q4) had a lower probability of reversing to normoglycemia during the follow-up period.

