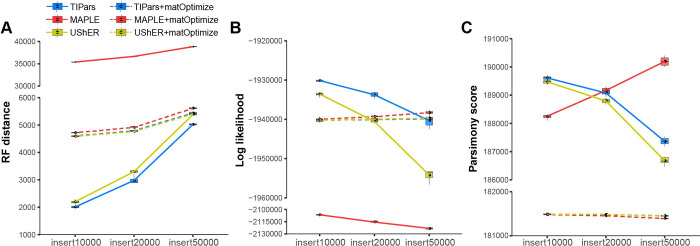
Fig 4. Multiple sequences insertion with tree topology refinement.
(A) RF distances between inferred trees and the reference tree for 10 leave-out tests of 10000, 20000 and 50000 taxa in SARS2-100k dataset respectively. Smaller values correspond to more similar to the reference tree. ‘X+matOptimize’ indicates the refined trees of X with tree topology optimized by matOptimize. (B) Log-likelihoods (LK) (computed by FastTree2 (double-precision version)) of phylogenies inferred by different methods. Larger values represent more likely estimates. (C) Parsimony scores (computed by UShER) of phylogenies inferred by different methods. Smaller values represent smaller number of substitutions needed for each site.

