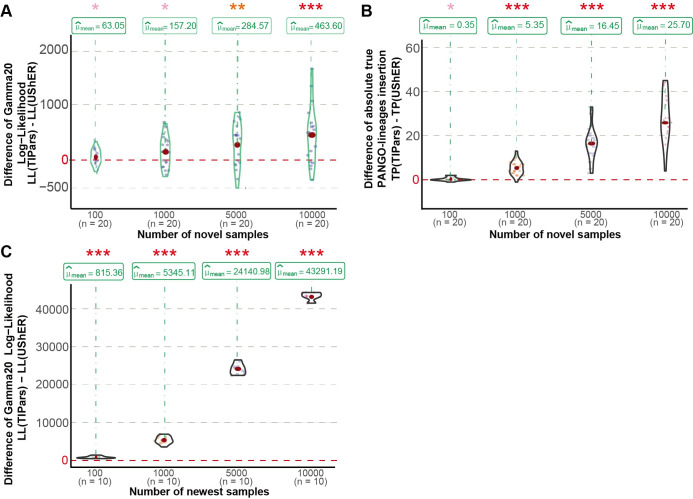
Fig 5. Performance of inserting novel real-world sequences.
(A) Violin graphs present the distributions of the paired differences between TIPars and UShER with respect to Gamma20 log-likelihood (LL) for insertion of novel sequences collected before January 1, 2021, the same timepoint as sequences for generating SARS2-100k reference. (B) Violin graphs present the distributions of the paired differences between TIPars and UShER with respect to the absolute number of true PANGO-lineages insertion (TP) for insertion of novel sequences collected before January 1, 2021. (C) Violin graphs present the distributions of the paired differences between TIPars and UShER with respect to LL for insertion of newest sequences submitted to GISAID in between January 1 2022 to June 4 2022. P-values for the right-sided paired t-tests are indicated by asterisks above each violin plot, where p<0.05 is indicated by one pink asterisk (*), p<0.01 by two orange asterisks (**) and p<0.001 by three red asterisks (***).

