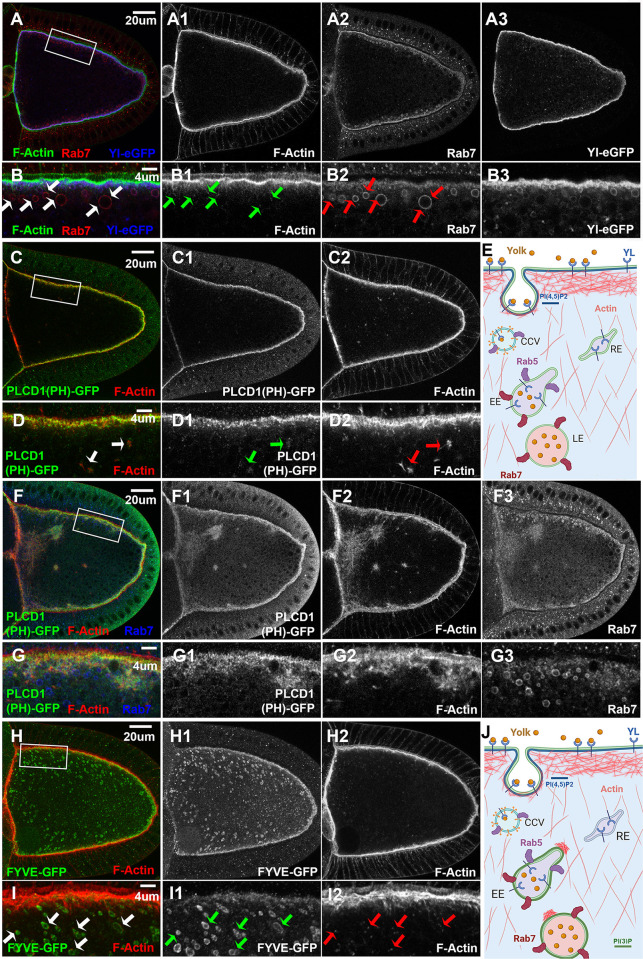
Fig 3. Actin cytoskeleton dynamics and phosphatidylinositol phospholipids in vitellogenic oocytes.
Confocal microscopy of stage 10 egg chambers co-labeled with phalloidin for F-Actin and anti-GFP antibody for (A, B) Yl-eGFP-3xHA (blue), (C, D, F, G) PI(4,5)P2 reporter PLCδ1(PH)-GFP (green) and (H,I) PI(3)P reporter 2xFYVE-GFP (green), respectively, (A, B, F, G) together with endogenous Rab7, from flies with the corresponding reporter lines, as indicated. (A, C, F, H) Overview of the distribution of (A) Yl-GFP-3xHA, (C, F) PLCδ1(PH)-GFP and (H) 2xFYVE-GFP, respectively, in the oocytes, as indicated. (B, D, G, I) High-magnification view of the corresponding cortex regions highlighted in (A, C, F, H), respectively, as annotated. (E) Cartoon illustration of the results from Fig 2 and Fig 3(A-D), showing the spatial relationship between Yl, PI(4,5)P2, F-Actin, Rab5 and Rab7 during endocytosis. (J) Cartoon illustration of the results from Fig 3, highlighting the association of F-Actin puncta with FYVE- and Rab7-positive granules. Genotypes: (A, B) w1118; p{mini-W+, yl-eGFP-3xHA}. Note that the oocyte in Fig 3(A,B) is the same oocyte imaged in Fig 2A. Other images were from females flies heterozygous for both matalpha4-GAL-VP16 driver (BDSC #7062) and the following UAS-transgenic lines: (C, D) UASp-PLCδ1(PH).Cerulean.6 (BDSC #31421). (F, G) UASp-PLC δ11(PH).Cerulean.2 (BDSC #30895); (H, I) UAS-GFP-myc-2xFYVE (BDSC #42712); The sizes of the scale bars as labeled.

