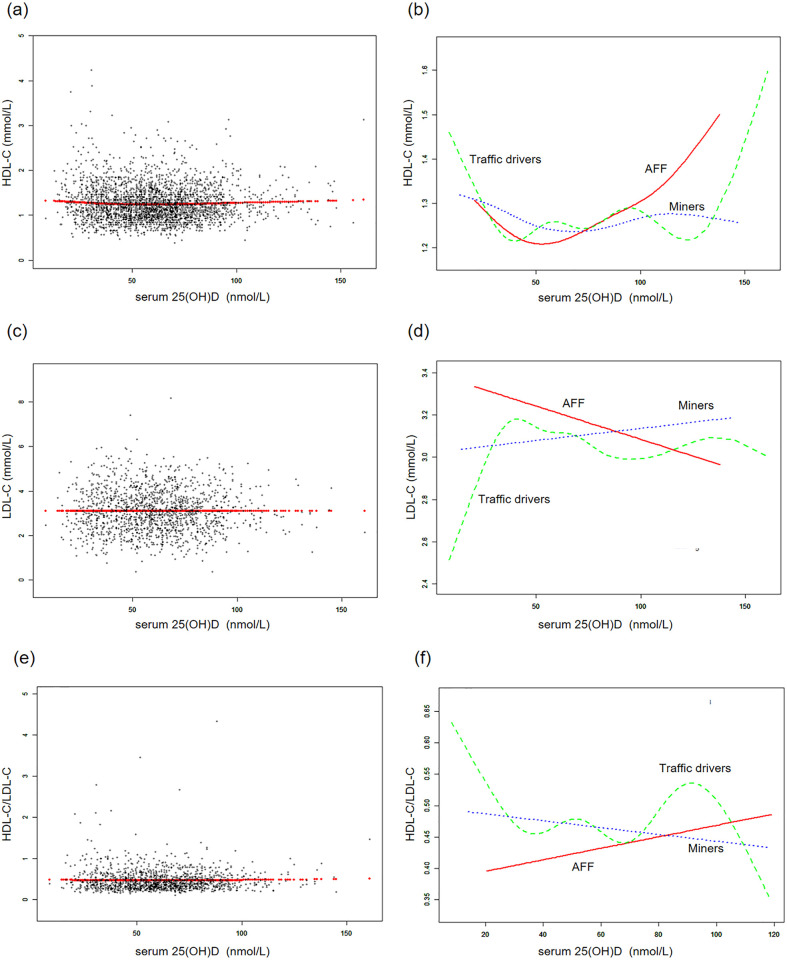
Fig 3. The associations between serum 25(OH)D concentrations and LDL cholesterol, LDL cholesterol, HDL-C/LDL-C.
(a, c, e) Each black point represents a sample and the red line represents the general trend of these samples. (b, d, f) Associations of serum 25(OH)D concentrations with LDL cholesterol, HDL cholesterol and HDL-C/LDL/C stratified by occupations. Sex, age, each particular race, BMI, smoking, heavy alcohol, diabetes, hypertension, vigorous physical activity, education level, and marital status were adjusted.

