Figure 1.
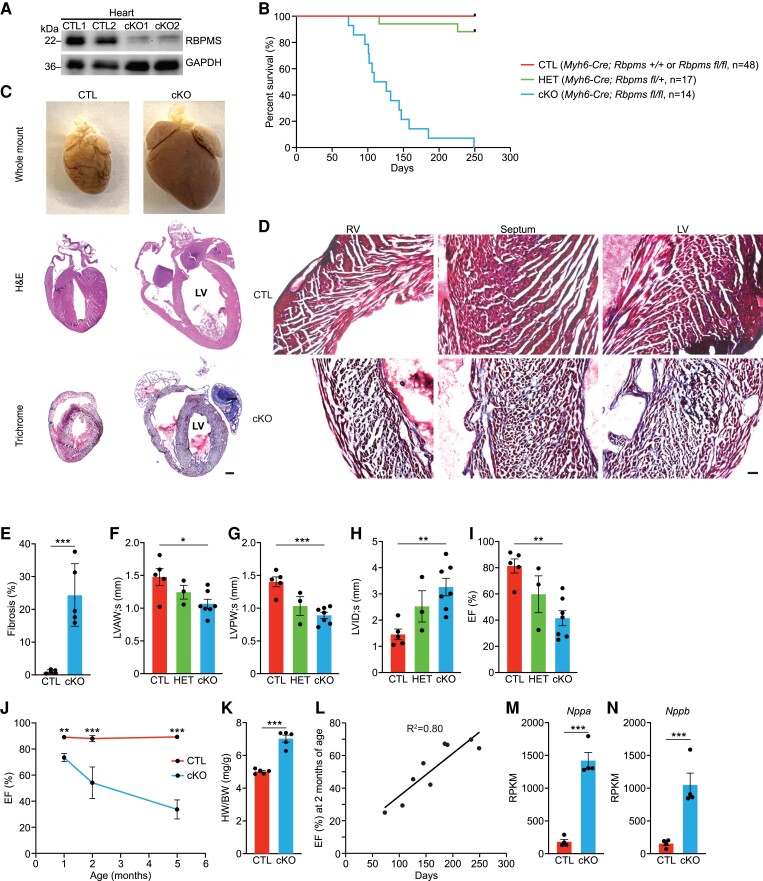
Cardiac-specific deletion of Rbpms causes early post-natal lethality and DCM in mice. (A) Western blot analysis showing RBPMS protein expression in the hearts of Rbpms CTL and cKO mice at 2 months of age (n = 2 for CTL and cKO). GAPDH is a loading control. (B) Survival curve of Rbpms CTL, HET, and cKO mice. (C) Whole mount (top panel), H&E (middle panel), and Masson’s trichrome-stained (bottom panel) coronal sections of CTL and cKO hearts at 4 months of age. Scale bar: 2 mm. (D) Masson’s trichrome staining showing regions of the left ventricle (LV), septum, and right ventricle (RV) of CTL and cKO hearts at 4 months of age. Scale bar: 50 μm. (E) Quantification of the percentage of fibrotic area over the whole myocardium in hearts at 4 months of age (n = 5 for CTL and cKO). (F–I) Measurements of LV anterior wall thickness at end cardiac systole (LVAW; s), LV posterior wall thickness at end cardiac systole (LVPW; s), LV internal dimension at end cardiac systole (LVID; s), and ejection fraction (EF%) of CTL (n = 5), HET (n = 3), and cKO (n = 7) hearts at 2 months of age by echocardiography. (J) Comparison of EF% between CTL and cKO hearts at 1, 2, and 5 months of age (n = 4–10 for CTL and cKO at each stage). (K) Quantification of heart weight to body weight ratios of CTL and cKO mice at 4 months of age. CTL (n = 5) and cKO (n = 5). (L) Scatter diagram showing the correlation between the EF% at 2 months of age and the life span of cKO mice (n = 9). (M, N) Expression levels of Nppa and Nppb mRNA in CTL and cKO hearts at 2 months of age, measured by RNA-seq (n = 4 for CTL and cKO). All data are presented as mean ± SEM. *P < 0.05, **P < 0.01; ***P < 0.001, by Student’s t-test two-tailed for E, J, K, M, N, and by one-way ANOVA and post hoc analysis with Bonferroni correction for F, G, H, I.

