Figure 2.
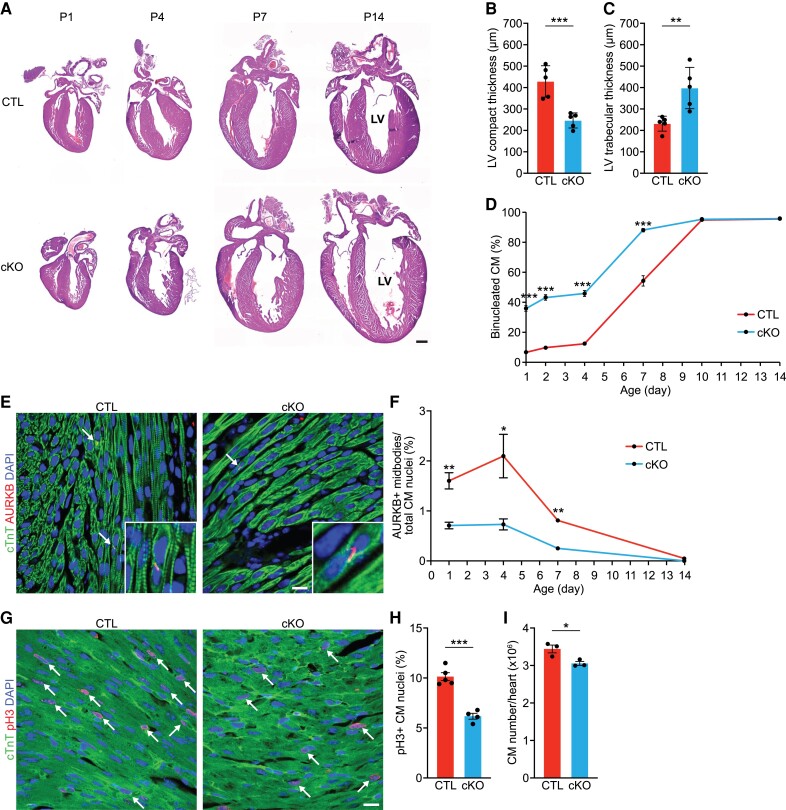
Rbpms cKO hearts exhibit myocardial non-compaction and progressive ventricular dilation. (A) Representative H&E images of CTL and cKO hearts at post-natal (P) days P1, P4, P7, P14. Scale bar: 500 μm. (B, C) Measurements of left ventricle (LV) compact myocardium, and trabecular zone thicknesses in coronal sections of P1 hearts at the level of papillary muscle roots (n = 5 for CTL and cKO). (D) Percentage of binucleated cardiomyocytes in CTL and cKO hearts at the indicated post-natal days (n = 3–6 for CTL and cKO mice at each stage, average 100–200 cardiomyocytes per mouse). (E) Representative immunofluorescence images of CTL and cKO hearts at P1 stained for AURKB and cTnT. Scale bar: 25 μm. White arrows indicate AURKB-positive midbodies between nuclei. (F) Percentage of AURKB-positive midbodies in CTL and cKO hearts at the indicated post-natal days (n = 5–7 for CTL and cKO at each stage). CM, cardiomyocyte. (G, H) Immunofluorescence staining for phosphorylated histone H3 (pH3), cTnI, and DAPI of CTL and cKO myocardium at P1 (G) and percentage of pH3+ CM nuclei (H). White arrows indicate pH3-positive CM nuclei. CTL (n = 5) and cKO (n = 4). P-value represents result of t-test. Scale bar: 25 μm. (I) Total cardiomyocyte (CM) number in CTL and cKO hearts at P14 (n = 3 for CTL and cKO). All data are presented as mean ± SEM. *P < 0.05, **P < 0.01; ***P < 0.001, by Student’s t-test two-tailed for B–D, F, H, I.

