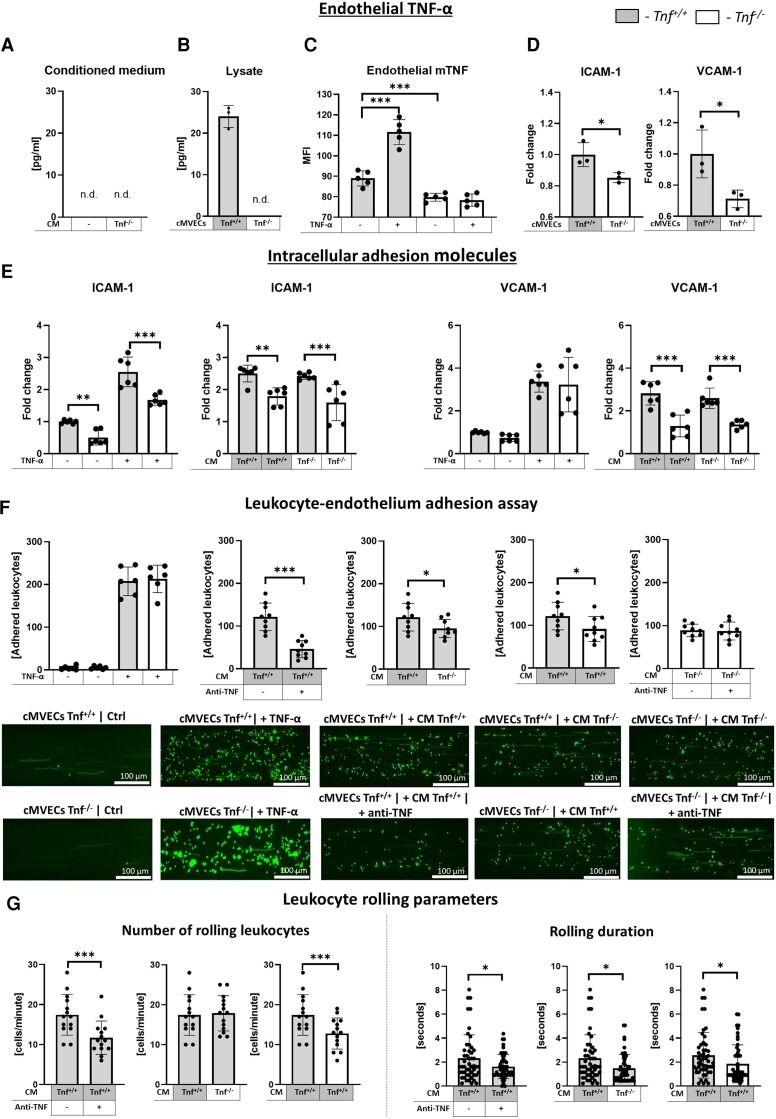
Figure 6.
Contribution of soluble and membrane TNF-α in cell adhesion. (A) Concentration of TNF-α (measured by ELISA) in supernatants of resting cMVECs and cMVECs stimulated with medium conditioned of activated Tnf−/− Teff cells and (B) in Tnf+/+ and Tnf−/− cMVECs lysates (n = 3). (C) Surface expression of TNF-α (measured by flow cytometry) on resting and TNF-α-stimulated Tnf+/+ and Tnf−/− cMVECs (n = 5). (D) Surface expression of ICAM-1 and VCAM-1 on freshly isolated CD31+ endothelial cells from wild-type (Tnf+/+) and Tnf−/− hearts (n = 3) and (E) in cMVECs stimulated for 16 h with 5 ng/mL TNF-α or with supernatants of MyHC-activated TCRM × Tnf+/+ or TCRM × Tnf−/− Teff cells cultured in the presence of the respective APCs for 3 days. (F) Quantification of firmly adhered splenocytes to cMVECs in the adhesion assay for indicated conditions. Fluorescence microphotographs show representative CFSE-labelled splenocytes in microcapillaries coated with cMVECs. Frequency of rolling splenocytes on the surface of cMVECs (n = 14) and the distance of the rolling splenocytes (n = 50) are presented for the indicated conditions in G. P values calculated with one-way ANOVA followed by multiple comparison using Fisher’s LSD test or with unpaired Student’s t-test. ns P > 0.05, *P < 0.05, **P < 0.01, ***P < 0.001.

