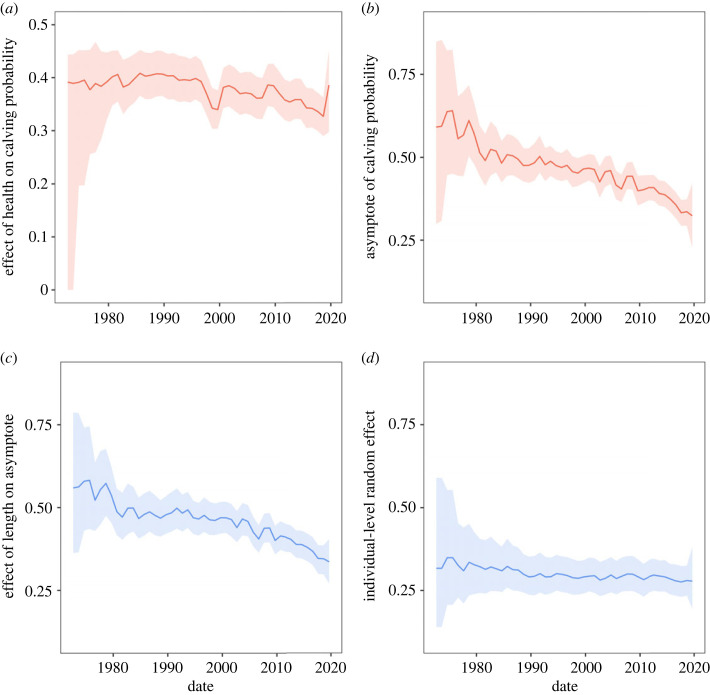
Figure 2.
Estimated components of calving probability in available years over the study period. Top row: (a) mean contribution of health to calving probability, given mean length (13.3 m) and random effect equal to the mean (−0.86); (b) mean asymptote of calving probability across females. Bottom row: (c) mean contribution of length to the asymptote of calving probability, calculated by setting the intercept to the mean (−0.86); (d) mean individual random effect on the asymptote of calving probability. The lines and ribbons indicate the posterior means and 95% credible intervals in each year.

