FIGURE.

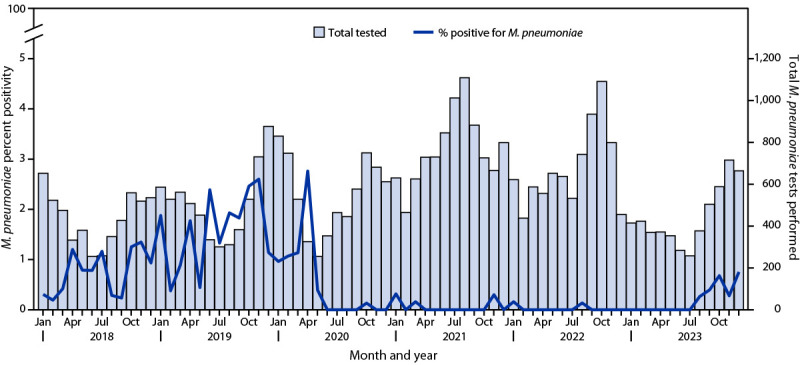
Monthly number of Mycoplasma pneumoniae tests performed and percentage of positive test results among children and adolescents with acute respiratory illness — four sites, New Vaccine Surveillance Network, 2018–2023

Monthly number of Mycoplasma pneumoniae tests performed and percentage of positive test results among children and adolescents with acute respiratory illness — four sites, New Vaccine Surveillance Network, 2018–2023