
FIGURE 2.
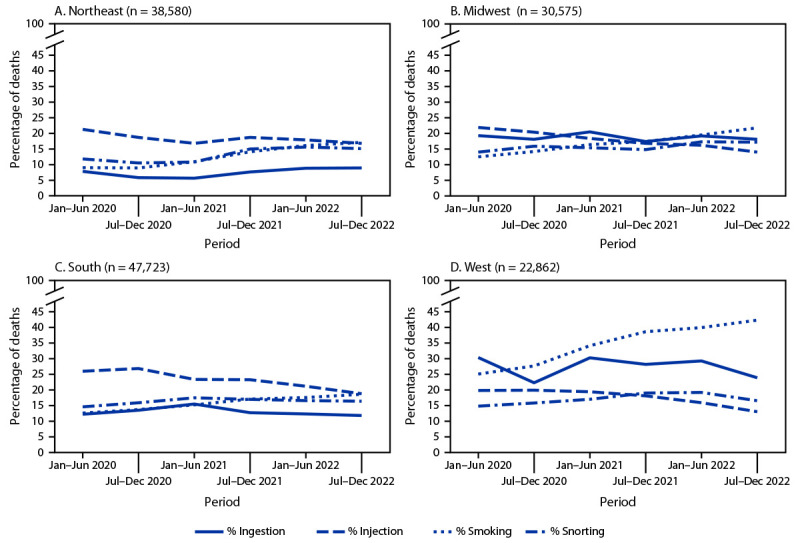
Percentage of drug overdose deaths with evidence of selected routes of drug use,* by U.S. Census Bureau region† and 6-month period of death (N = 139,740) — State Unintentional Drug Overdose Reporting System, 28 jurisdictions,§ January 2020–December 2022
* Percentages with evidence of other routes (i.e., buccal, sublingual, suppository, or transdermal) are not presented because of small sample sizes (Panel A [Northeast]: 136, 0.4%; Panel B [Midwest]: 121, 0.4%; Panel C [South]: 223, 0.5%; and Panel D [West]: 103, 0.5%); decedents with drug use via these routes are included in the denominators. In addition, percentages of decedents with no information on route are not shown (Panel A: 22,541, 58.4%; Panel B: 15,381, 50.3%; Panel C: 22,571, 47.3%; and Panel D: 7,767, 34.0%); these decedents are also included in the denominators.
† Analysis included some, but not all, of the jurisdictions in each U.S. Census Bureau region. Northeast: Connecticut, Maine, Massachusetts, New Hampshire, New Jersey, Pennsylvania, Rhode Island, and Vermont; Midwest: Illinois, Kansas, Minnesota, Nebraska, and Ohio; South: Delaware, District of Columbia, Georgia, Kentucky, Maryland, North Carolina, Oklahoma, Virginia, and West Virginia; West: Alaska, Arizona, Colorado, Oregon, Utah, and Washington.
§ Jurisdictions were included if medical examiner or coroner reports and toxicology reports were available for ≥75% of deaths during January 2020–December 2022. Analysis was restricted to deaths with an available medical examiner or coroner report (139,740; 95.8% of all deaths).