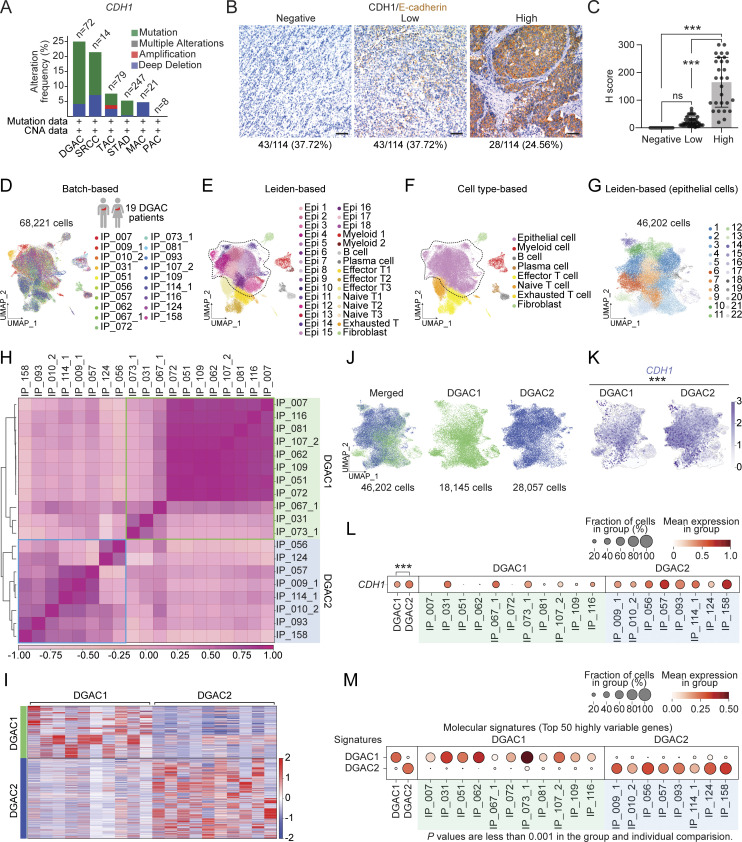
Figure 1.
CDH1 inactivation in DGAC patient tumor cells. (A) Genetic alterations of the CDH1 based on the cBioPortal stomach cancer datasets (https://www.cbioportal.org). n represents the total patients number enrolled in each subtype. DGAC, diffuse-type gastric adenocarcinoma; SRCC, signet ring cell carcinoma; TAC, tubular adenocarcinoma; STAD, stomach adenocarcinoma; MAC, mucinous adenocarcinoma; PAC, papillary adenocarcinoma. (B and C) IHC staining of CDH1/E-cadherin in 114 DGAC patient tumor samples. The representative images are shown; scale bar: 50 μm (B). Quantification of H score of CDH1 expression (C). P values were calculated using the one-way ANOVA; error bars: standard deviation (SD). Clinical information of 114 DGAC patients is available in Table S4. (D) Integrated batch-based UMAPs of 19 DGAC patients; integration package: Harmony. Clinical information of 19 DGAC patients is available in Table S5. (E) Integrated Leiden-based UMAP of 19 DGAC patients. Dashed line circle: epithelial cells. Epi: epithelial cells; Myeloid: myeloid cells; Effector T: effector T cells; Naïve T: naïve T cells; Exhausted T: exhausted T cells. (F) Integrated cell type-based UMAP of 19 DGAC patients. All cells were reclustered according to the Leiden clusters and gathered as mega clusters. Dashed line circle: epithelial cells. (G) Epithelial cells were reclustered by Leiden. (H) Correlation matrix plot of epithelial cells showing pair-wise correlations among all samples above. The dendrogram shows the distance of each dataset based on principal component analysis, and the Pearson correlation is displayed with a color spectrum. Groups of patients were categorized by dendrogram and correlation. (I) Type-based heatmap of epithelial cells of integrated datasets in 19 DGAC patients. The top 100 highly variable genes of each type are shown in Table S8. (J) Type-based integrated and separated UMAPs of DGAC1 and DGAC2. (K) Feature plots of epithelial cells displaying CDH1 expression. (L) Dot plots of epithelial cells of CDH1 expression in different DGAC groups and individual patients. P values were calculated by using a t test. (M) Molecular signatures of DGAC1 and DGAC2 patients. Top 50 highly variable genes were used to calculate the molecular signature of each group. Gene list is shown in Table S8. Dot plots of epithelial cells of each molecular signature in different subtypes and individual patient. P values were calculated by Mann–Whitney testing. ns: P > 0.05, ***: P ≤ 0.001. All data are derived from two or more independent experiments with the indicated number of human donors.

