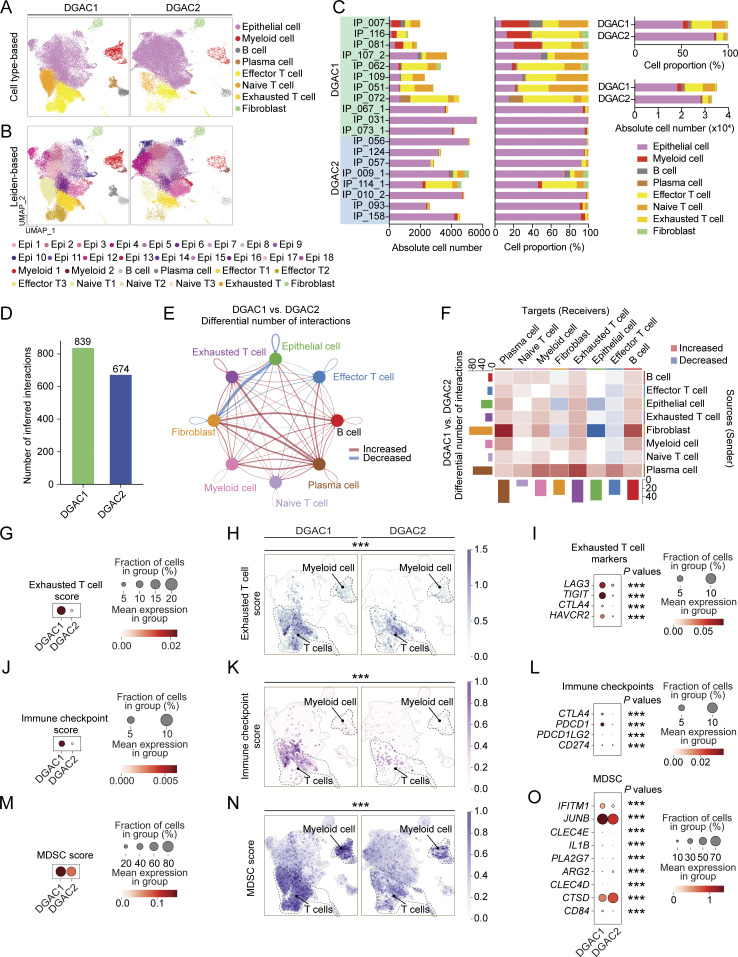
Figure 2.
Comparative analyses of immune landscapes of DGAC subtypes. (A and B) Cell type-based and Leiden-based UMAPs of DGAC1 and DGAC2. (C) Absolute and relative cell proportions of individual patients and DGAC subtypes. Patients list was ranked by the DGAC group they belong. (D) Total cell–cell interactions from DGAC1 and DGAC2 were analyzed by using the CellChat package. More interactions were found in DGAC1. (E and F) Differential number of interactions between DGAC1 and DGAC2 using circle plots (E) and heatmap (F). Red (or blue) colored edges (E) and squares (F) represent increased (or decreased) signaling in the DGAC1 compared to DGAC2. (G–I) Score-based dot plot (G), feature plots (H), and dot plot of individual marker gene (I) of exhausted T cell score (markers are included in that score: LAG3, TIGIT, CTLA4, and HAVCR2). Genes that were included in score analysis are shown in Table S9, P values were calculated by Mann–Whitney testing. For the dot plot of a single gene, P values were calculated by using a t test. (J–L) Score-based dot plot (J), feature plots (K), and dot plot of individual marker gene (L) of immune checkpoint score (markers are included in that score: CTLA4, PDCD1, PDCD1LG2, and CD274). Genes that were included in score analysis are shown in Table S9, P values were calculated by Mann–Whitney testing. For the dot plot of single gene, P values were calculated by using a t test. (M–O) Score-based dot plot (M), feature plots (N), and dot plot of individual marker gene (O) of exhausted T cell score (markers are included in that score: IFITM1, JUNB, CLEC4E, IL1B, PLA2G7, ARG2, CLEC4D, CTSD, and CD84). Genes that were included in score analysis are shown in Table S9, P values were calculated by Mann–Whitney testing. For the dot plot of single gene, P values were calculated by using a t test. ***: P ≤0.001. All data are derived from two or more independent experiments with the indicated number of human donors.

