Figure S1.
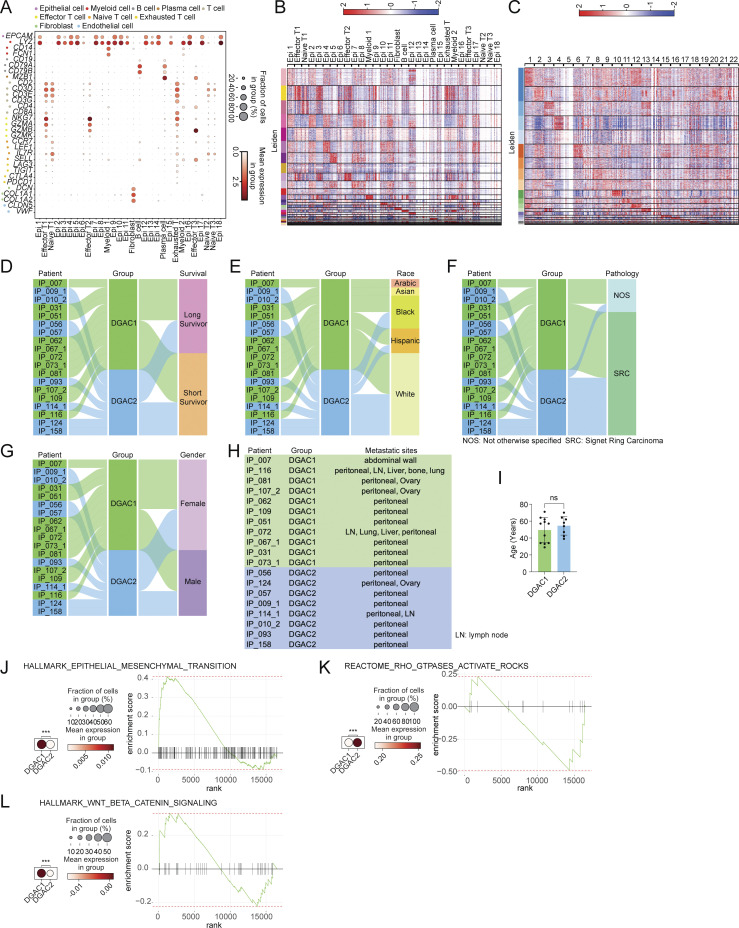
Transcriptional, clinical, and molecular characterization of DGAC subtypes. (A) Dot plots of epithelial cell, myeloid cell, B cell, plasma cell, T cell, effector T cell, naïve T cell, exhausted T cell, fibroblast, and endothelial cell markers in integrated 19 DGAC patients scRNA-seq data. (B) Leiden-based heatmap of all cells of integrated datasets with annotations in 19 DGAC patients. The most highly variable 100 genes of each cluster are shown in Table S6. (C) Leiden-based heatmap of epithelial cells of integrated datasets in 19 DGAC patients. The most highly variable 100 genes of each cluster were showed in Table S7. (D–G) Venn diagram illustrating 19 DGAC patient groups with survival, race, pathology, and gender data. Long-term survivors (surviving over 1 year after diagnosis) and short-term survivors (deceased within 6 mo post-diagnosis) were classified according to our previous publication (Wang et al., 2021). (H) Metastatic sites of DGAC1 and DGAC2 patients. (I) Age difference between DGAC1 and DGAC2 patients. P values were calculated using Student’s t test; error bars: SD. (J–L) Dot plots and GSEA of EMT (J), RHOA (K), and WNT (L) scores in two DGAC types. The datasets we used for dot plots and GSEA are from GSEA molecular signature database (https://www.gsea-msigdb.org/gsea/msigdb/index.jsp): EMT: Human Gene Set: HALLMARK_EPITHELIAL_MESENCHYMAL_TRANSITION; RHOA: Human Gene Set: REACTOME_RHO_GTPASES_ACTIVATE_ROCKS; WNT: Human Gene Set: HALLMARK_WNT_BETA_CATENIN_SIGNALING. P values were calculated by Mann–Whitney testing (J–L). The genes included in each score are listed in Table S9. ns: P > 0.05; ***: P ≤ 0.001. All data are derived from two or more independent experiments with the indicated number of human donors.

