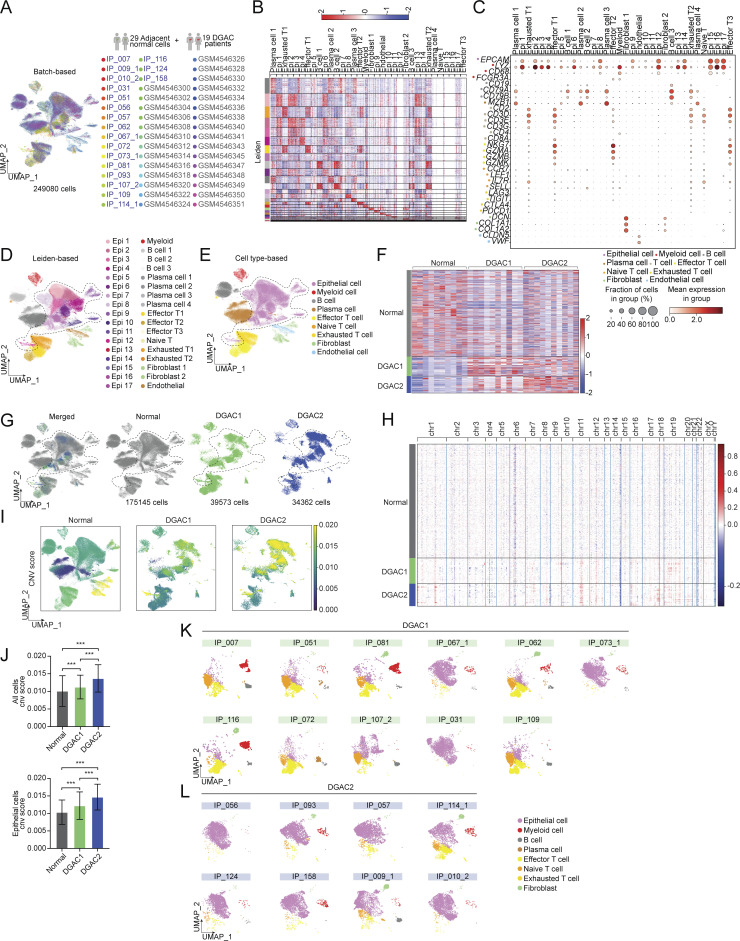
Figure S2.
scRNA-seq analysis of 19 DGAC patients and 29 adjacent normal stomach tissue. (A) Integrated batch-based UMAP of 29 adjacent normal stomach tissue (normal tissue) and 19 DGAC patients. Total cell numbers are 249,080. Integration package: Harmony. (B) Annotated Leiden-based integrated UMAPs of 19 DGAC patients and 29 adjacent normal stomach tissue. Epi: Epithelial cells; Myeloid: myeloid cells; Effector T: effector T cells; Naïve T: Naïve T cells; Exhausted T: Exhausted T cells; Endothelial: Endothelial cells. (C) Dot plots of epithelial cell, myeloid cell, B cell, plasma cell, T cell, effector T cell, naïve T cell, exhausted T cell, fibroblast, and endothelial cell markers in integrated 19 DGAC patients and 29 adjacent normal stomach tissue scRNA-seq data. (D) Integrated Leiden-based UMAPs of 29 adjacent normal stomach tissue (normal tissue) and 19 DGAC patients. Epi: epithelial cells; Myeloid: myeloid cells; Effector T: effector T cells; Naïve T: naïve T cells; Exhausted T: exhausted T cells. The most highly variable 100 genes of each cluster are shown in Table S10. (E) Integrated cell type–based UMAP of 29 normal tissue and 19 DGAC patients. All cells were reclustered according to the Leiden clusters and gathered as mega clusters. Dashed line-circle: epithelial cells. (F) Type-based heatmap of all cells of integrated datasets in 19 DGAC patients and 29 adjacent normal stomach tissue. (G) Separated UMAPs of normal tissue and two types of DGACs. Dashed line-circle: epithelial cells. (H) CNV heatmap of DGAC1 and DGAC2, tumor-adjacent normal stomach tissue (Normal) was used as a reference for the CNV inference. Red: copy number gain (CNG); blue: copy number loss (CNL). (I) CNV heatmap of DGAC1 and DGAC2, tumor-adjacent normal stomach tissue (Normal) was used as reference for the CNV inference. (J) Statistics analysis of CNV score of all cells (left panel) and epithelial cells (right panel) among Normal, DGAC1, and DGAC2. P values were calculated using the one-way ANOVA; error bars: SD. (K and L) Individual cell type–based UMAP of the patients in DGAC1 and DGAC2. DGAC1 patients were enriched with stromal cells, mainly T cells. DGAC2 patients were enriched with epithelial cells. ***: P ≤ 0.001. All data are derived from two or more independent experiments with the indicated number of human donors.

