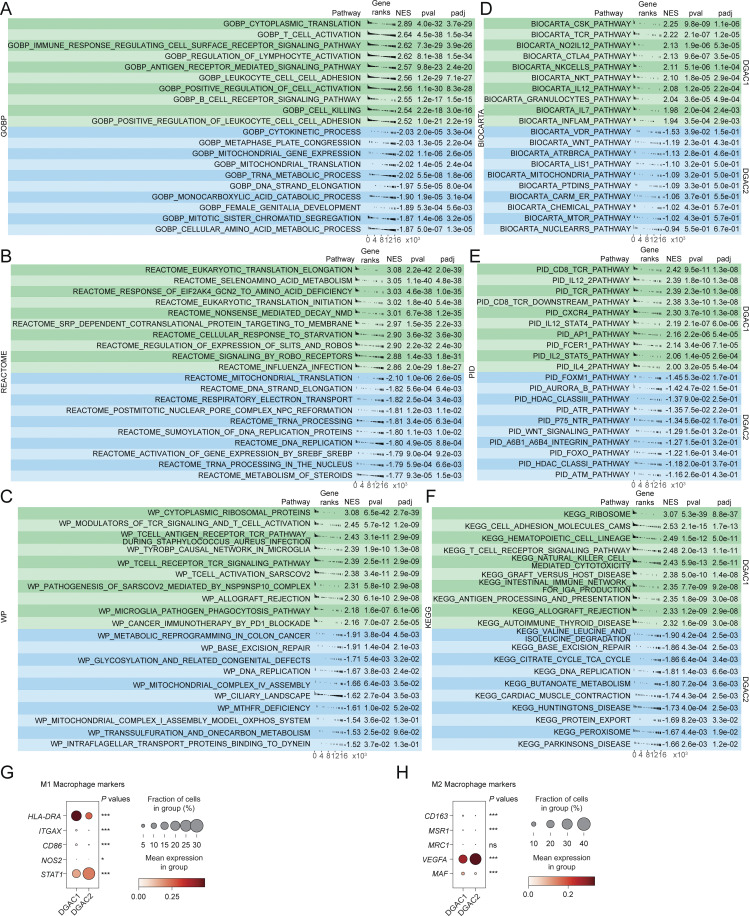
Figure S3.
GSEA analysis and the expression of macrophage polarization markers of DGAC1 and DGAC2. (A–F) GSEA analysis comparing DGAC1 to DGAC2 using DGAC2 as the reference gene set. Enriched pathways in DGAC1 are displayed in the upper green panel, while those in DGAC2 are shown in the lower blue panel. Pathway datasets analyzed include GOBP (A), REACTOME (B), WP (C), BIOCARTA (D), PID (E), and KEGG (F). Pathways with positive normalized enrichment score (NES) indicate enrichment in DGAC1, while those with negative NES indicate enrichment in DGAC2. GOBP: gene ontology biological process; REACTOME: reactome gene sets; WP: WikiPathways gene sets; BIOCARTA: BioCarta gene sets; PID: PID gene sets; KEGG: KEGG gene sets. Pathways related with immune response were enriched in DGAC1 based on GOBP, WP, BIOCARTA, PID, and KEGG. (G and H) Dot plot of macrophage polymerization markers in DGAC1 and DGAC2. Most of the M1 and M2 markers are enriched in DGAC1, except for STAT1 and VEGFA. P values were calculated by using a t test. ns: P > 0.05; *: P ≤ 0.05; ***: P ≤ 0.001. All data are derived from two or more independent experiments with the indicated number of human donors.

