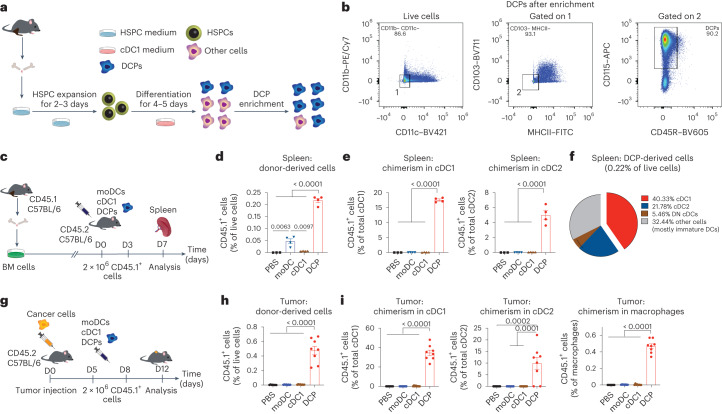
Fig. 1. DCPs efficiently generate cDCs in mice.
a, Procedure to generate DCPs from the mouse BM cells. b, Phenotype of DCPs after enrichment of lineage-negative cells. c, Procedure to study the fate of adoptively transferred DCPs, moDCs or cDC1-like cells in tumor-free mice. All DC types were generated from the BM of CD45.1 mice and transferred to CD45.2 mice. d, Engraftment of CD45.1+ cells derived from DCPs, moDCs and cDC1-like cells (mean ± s.e.m.; n = 3 mice for PBS and n = 4 for DCPs, moDCs and cDC1-like cells) in the spleen of recipient mice, 4 days after the last cell dose. Statistical analysis by one-way ANOVA with Tukey’s multiple comparison test. e, Donor cell chimerism in cDC1 and cDC2 (mean ± s.e.m.; n = 3 mice for PBS and n = 4 for DCPs, moDCs and cDC1-like cells). Statistical analysis by one-way ANOVA with Tukey’s multiple comparison test. f, Pie chart showing the fate of DCPs in the spleen (mean values; n = 4 mice). Double-negative (DN) DCs are defined as CD8a– CD11b– cDCs. Other cells mostly comprise CD11c+ MHCII–/low immature DCs. g, Procedure to study the fate of DCPs in MC38 tumor-bearing mice. h, Engraftment of CD45.1+ cells derived from DCPs, moDCs and cDC1-like cells (mean ± s.e.m.; n = 7 mice for PBS and n = 8 for DCPs, moDCs and cDC1-like cells) in the tumor of recipient mice, 4 days after the last cell dose. Statistical analysis by one-way ANOVA with Tukey’s multiple comparison test. i, Donor cell chimerism in cDC1, cDC2 and macrophages in the tumor of recipient mice (mean ± s.e.m.; n = 7 mice for PBS and n = 8 for DCPs, moDCs and cDC1-like cells). Statistical analysis by one-way ANOVA with Tukey’s multiple comparison test. Each data point represents one sample from an independent mouse.

