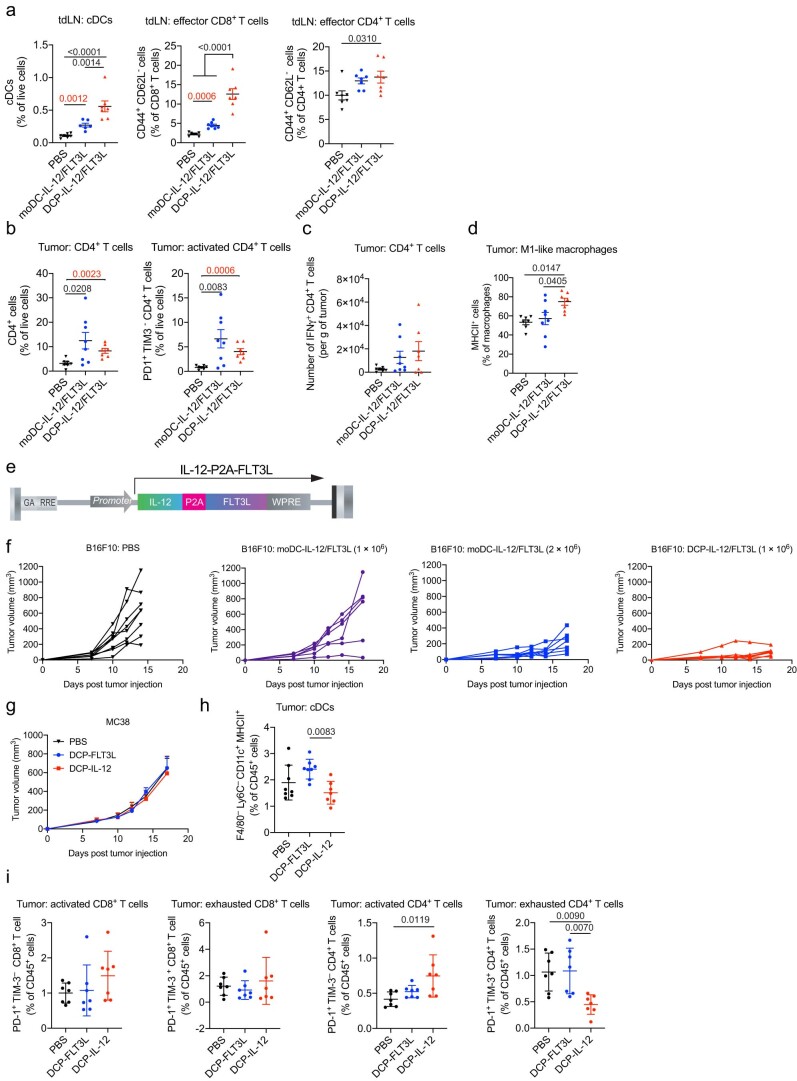
Extended Data Fig. 6. DCPs offer an effective cytokine-delivery platform alternative to moDCs.
a–d, Frequency of the indicated cell types in B16F10 tdLNs and tumors of mice treated with cytokine-armed DCPs or moDCs (mean ± SEM; PBS, n = 7 mice; DCP-IL-12/FLT3L, n = 7; moDC-IL-12/FLT3L, n = 7-8). Statistical analysis by one-way ANOVA with Tukey’s multiple comparison test (black p values) or two-tailed Mann-Whitney test (red p values). e, Schematic of the bicistronic LV construct used to co-express IL-12 and FLT3L. f, Growth of individual B16F10 tumors in mice (PBS, n = 8 mice; DCP-IL-12/FLT3L (1 × 10⁶), n = 7; moDC-IL-12/FLT3L (1 × 10⁶), n = 6; moDC-IL-12/FLT3L (2 × 10⁶), n = 7). g, MC38 tumor growth in mice. Data show tumor volume (mean ± SEM; n = 8 mice). Statistical analysis by two-way ANOVA with Tukey’s multiple comparison test (not significant). h-i, Frequency of the indicated cell types in MC38 tumors (mean ± SEM; PBS, n = 8 mice in (h) and n = 7 in (i); DCP-IL-12, n = 7; DCP-FLT3L, n = 8 in (h) and n = 7 in (i)). Statistical analysis by one-way ANOVA with Tukey’s multiple comparison test. Each data point represents one sample or tumor measurement from an independent mouse, except for (g) in which each point represents the mean volume of independent tumors.

