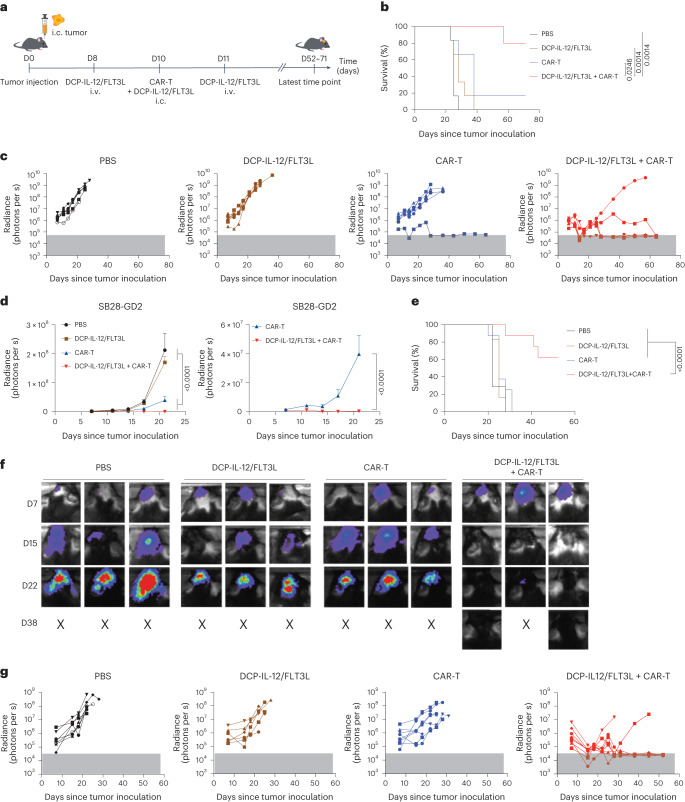
Fig. 7. Cytokine-armed DCPs synergize with CAR-T cells to eradicate mouse gliomas.
a, Procedure to study the combination of DCP-IL-12/FLT3L and CAR-T cells for the treatment of the SB28-GD2 glioma model. Mice received cytokine-armed DCPs both intracranially (i.c.) and intravenously (i.v.), and CAR-T cells intracranially. b, Survival analysis (PBS, n = 6 mice; DCP-IL-12/FLT3L, n = 6; CAR-T, n = 6; DCP-IL-12/FLT3L + CAR-T, n = 5). Mice were monitored for up to 71 days. Statistical analysis by log-rank Mantel–Cox test. c, Growth of individual tumors assessed by in vivo fluorescence imaging (IVIS) (n values as in b). The gray box indicates background radiance signal. d, Tumor burden quantified by IVIS imaging (mean radiance ± s.e.m.; n values as in b) shown until day 20, a time point when all the mice were still alive. The graph on the right shows the CAR-T and DCP-IL-12/FLT3L + CAR-T treatment groups separately. Statistical analysis by two-way ANOVA with Tukey’s (left) or Sidak’s (right) multiple comparison test. e, Survival analysis (PBS, n = 7 mice; DCP-IL-12/FLT3L, n = 6; CAR-T, n = 8; DCP-IL-12/FLT3L + CAR-T, n = 8). One mouse in the DCP-IL-12/FLT3L + CAR-T cohort was terminated while being tumor-free according to IVIS and post-mortem analysis. Mice were monitored for up to 52 days. Statistical analysis by log-rank Mantel–Cox test. f, IVIS imaging data of three representative mice from e per treatment condition (n values as in e). g, Growth of individual tumors assessed by IVIS imaging (n values as in e). The gray box indicates background radiance signal. Each data point in c and g represents one tumor measurement; each data point in d represents the mean volume of independent tumors.

