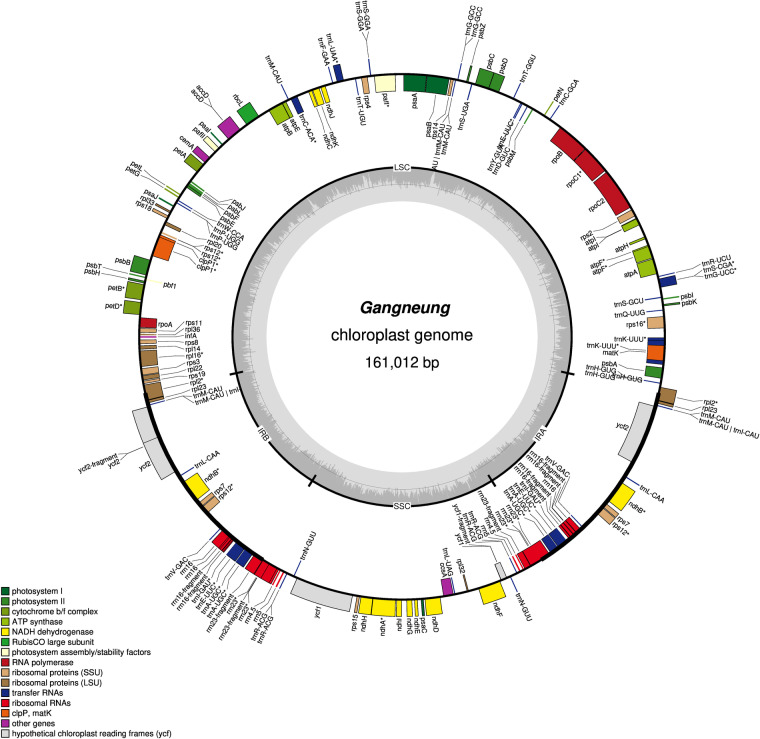
Fig. 1.
Circular map of the chloroplast genome in H. syriacus var. Gangneung. The center of the plot displays the cultivar name and genome length. The inner grey circle represents the GC content proportion in each region, with the line representing 50%. Genes located outside the outer circle are transcribed counterclockwise, and those inside the circle are transcribed clockwise. Genes with different functional annotations are differentiated by color.

