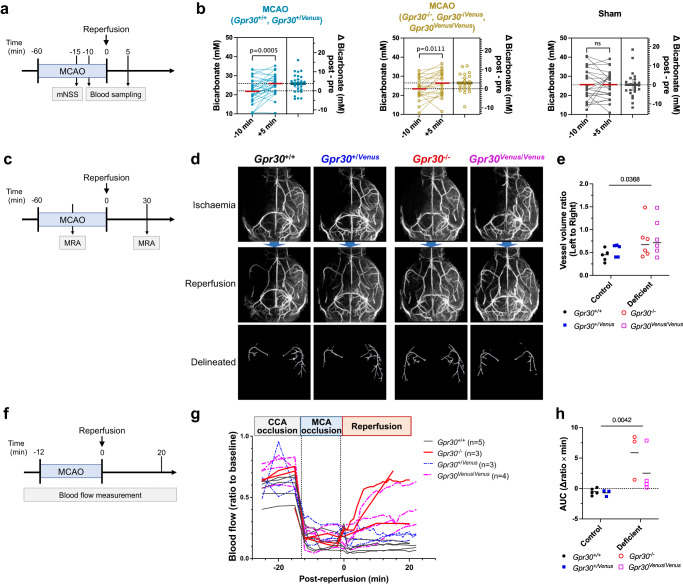
Fig. 8. Rapid recovery of cerebral blood flow in the MCA region upon reperfusion in Gpr30-deficient mice.
a, b Measurement of serum concentration of bicarbonate ions during ischaemia and reperfusion. a Experimental design. The modified Neurological Severity Score (mNSS) was evaluated at 45 min of MCAO, and blood was collected before (−10 min) and after ( + 5 min) reperfusion. b Changes in serum bicarbonate levels in Gpr30+/+ and Gpr30+/Venus (left), Gpr30−/−, Gpr30−/Venus, and Gpr30Venus/Venus (middle), and sham-operated (right) mice. A set of data collected at pre- and post-reperfusion from the same mouse are connected with a line (left box). The difference in serum bicarbonate concentration (Δbicarbonate (mM) post − pre) presented as dot plots with mean (right box). c–e Magnetic resonance angiography (MRA) analysis before and after reperfusion. c Experimental design. d Maximal intensity projection images before (top) and after (middle) reperfusion. Delineated MCA and branches after reperfusion are shown (bottom). e Vessel volume of the left MCA and its branches (reperfusion side) as a ratio to that of the right (control side). f–h Measurement of cerebral blood flow using laser Doppler flowmetry. f Experimental design. g Normalised blood flow as a ratio to the basal blood flow. h Area under the curve of the blood flow from 0 to 20 min during the reperfusion phase. Statistical analysis: b two-tailed paired t-test. e, h the main effect in two-way ANOVA. Data are presented as dot plots with median. P values are shown if significant. ns indicates no significant difference. Source data are provided as a Source Data file.

