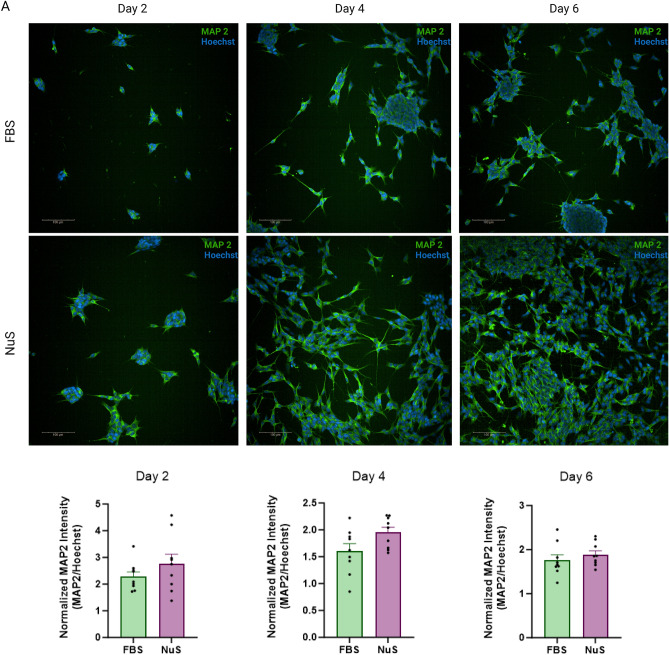
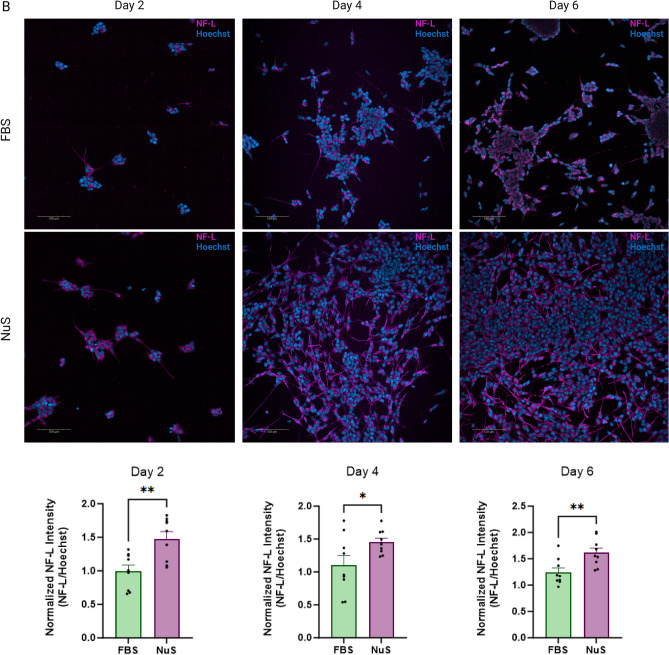
Figure 3.
NuS treatment accelerates neuron-like morphology development in cells. Immunofluorescent images for MAP2 (A) and NF-L (B) of SH-SY5Y cells in FBS group and NuS group on day 2, day 4, and day 6. Nuclei in blue, MAP2 in green, NF-L in magenta. Scale bar = 100 μm. Bar graphs are representing the IF intensity quantification reflecting the MAP2/Hoechst (A) and NF-L/Hoechst (B) intensity, n = 9 areas. Data are analyzed with Unpaired t-test and are represented as mean ± SEM. *p ≤ 0.05, **p ≤ 0.01.


