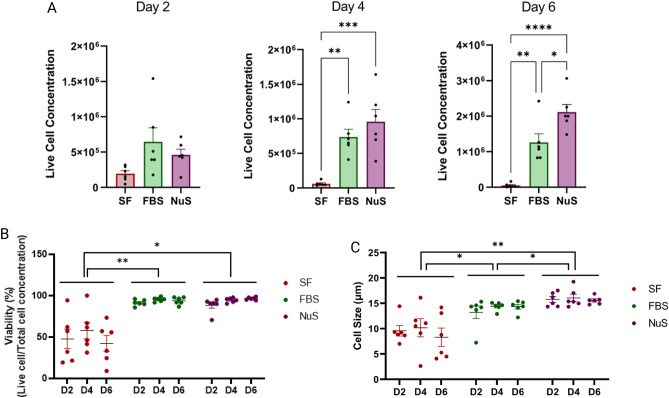
Figure 4.
NuS treatment enhances cell number, viability, and size compared to FBS and SF treatments. (A) Cell counts (B), viability, and (C) size were measured on days 2, 4, and 6 (n = 6 biological replicates). (**p ≤ 0.01, ***p ≤ 0.001, ****p ≤ 0.0001). Data are analyzed with Two-way ANOVA followed by Tukey’s multiple comparison test and unpaired t-test and are represented as mean ± SEM. *p ≤ 0.05, **p ≤ 0.01, ***p ≤ 0.001, ****p ≤ 0.0001.

