Figure 1.
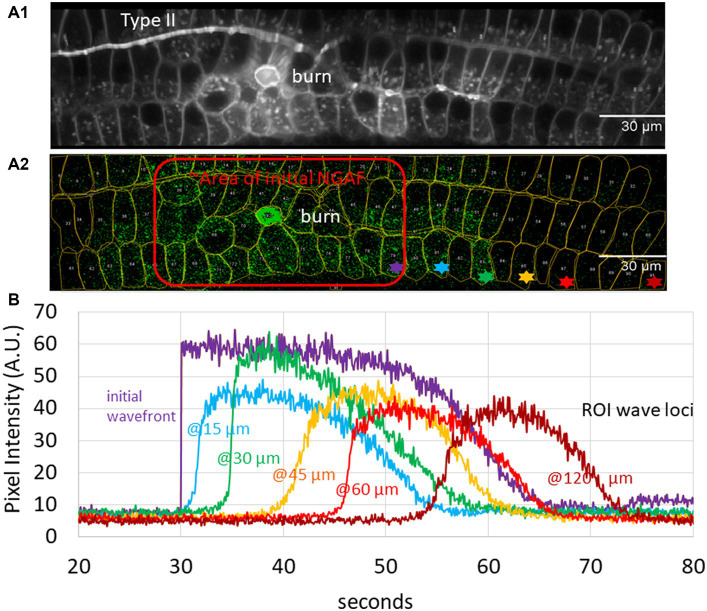
Analysis of autofluorescence – (Non-GCaMP Associated Fluorescence [NGAF]) in damaged cochlear epithelium; images from Th2ACreEr x Gcamp6ffl/fl mouse tissue of Nowak et al. (36). (A1) Standard deviation image of time series z-projection spanning 5.5 min in total (80 ms/slice). A central region of initial damage (“burn”), and a type II neuron are visible. (A2) A single 80 ms slice 14 s after the focused laser ablation (central bright green circle) shows one time point of spreading NGAF fluorescence. Red outline shows approximate initial response area (burn plus 9 s). Regions of interest (ROIs) from A1 overlaid. Colored asterisks denote exemplar ROIs used to determine wave velocity. (B) Average pixel intensity from Z projection for asterisked ROIs in A2.

