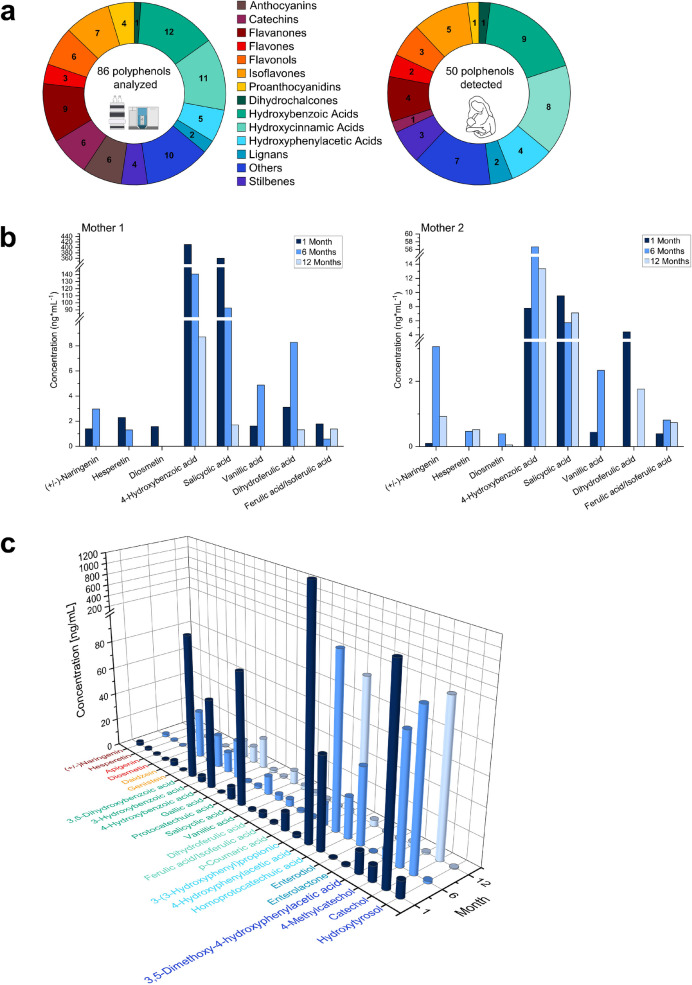
Fig. 2.
a Pie charts showing the number of polyphenol analytes included in the method (left) and the number of polyphenol analytes detected in the pilot study (right) separated by their polyphenol class. b Boxplots of the concentrations for selected analytes at the three different sampling time points for two Nigerian mothers. Only analytes detected with concentrations over the LOQ are displayed. c A 3D boxplot of the average concentration between the twelve mothers for each analyte detected, separated by time points. Only the analytes that were detected at least once per time point and had a concentration over the LOQ are shown

