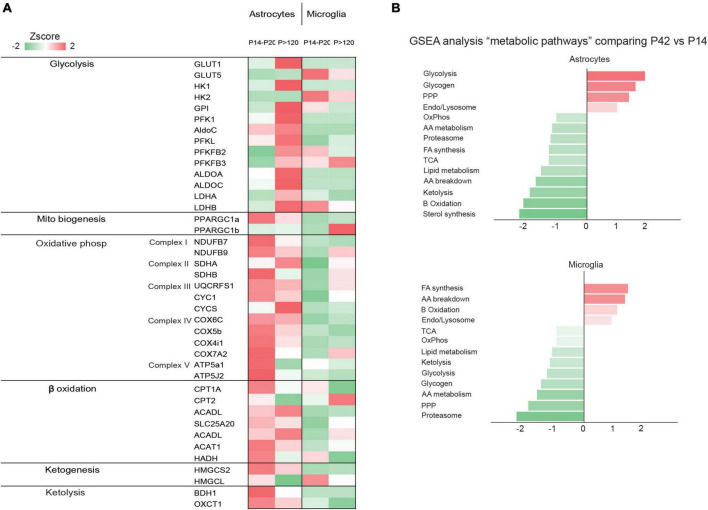
FIGURE 2.
(A) The heatmap shows the gene expression levels of glycolytic enzymes in astrocytes, neurons, microglia, endothelial cells, and oligodendrocytes. Data obtained from published data by Zhang et al. (2014, 2016); Bennett et al. (2016); Clarke et al. (2018); Düking et al. (2022); (B) The graph shows normalized enrichment score of the “metabolic pathways” gene sets by gene set enrichment analysis, comparing z-scores of astrocyte and microglia proteomes from P42 vs. P14. The figure is a modified version of Figure 1D in Düking et al. (2022).

