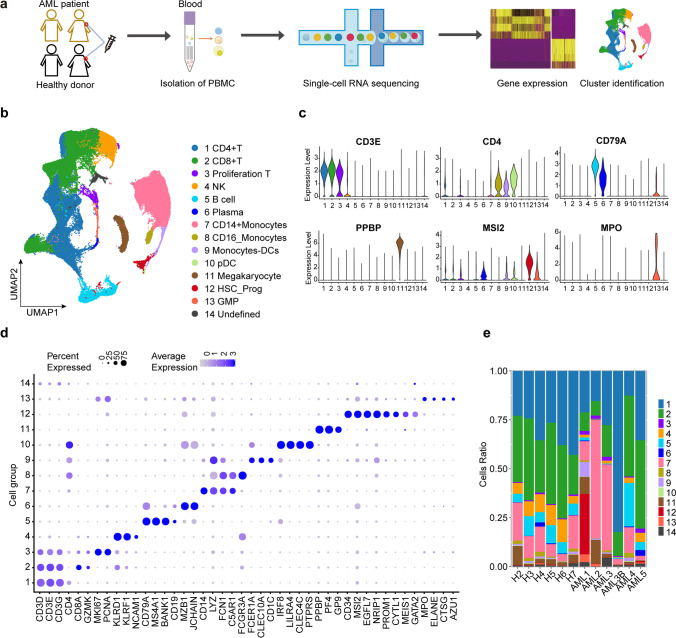
Fig. 1.
Single-cell transcriptomic analysis in AML patient PBMC cells and healthy donor PBMC cells. a Graphical view of the study roadmap. Single-cell suspensions were collected from five AML patients and six healthy donors, followed by scRNA-seq on the 10 × Genomics platform. b UMAP analysis of 91,772 qualified single cells resulted in identifying 14 major cell type clusters. Clusters are labelled in different colours and numbers. c Violin plots show the expression levels of some marker genes across the 14 cellular clusters. d Dot plots show the signature gene expression levels across the 14 cellular clusters. e Relative proportion of cell clusters in each AML patients or healthy donors across the main 14 cellular clusters

