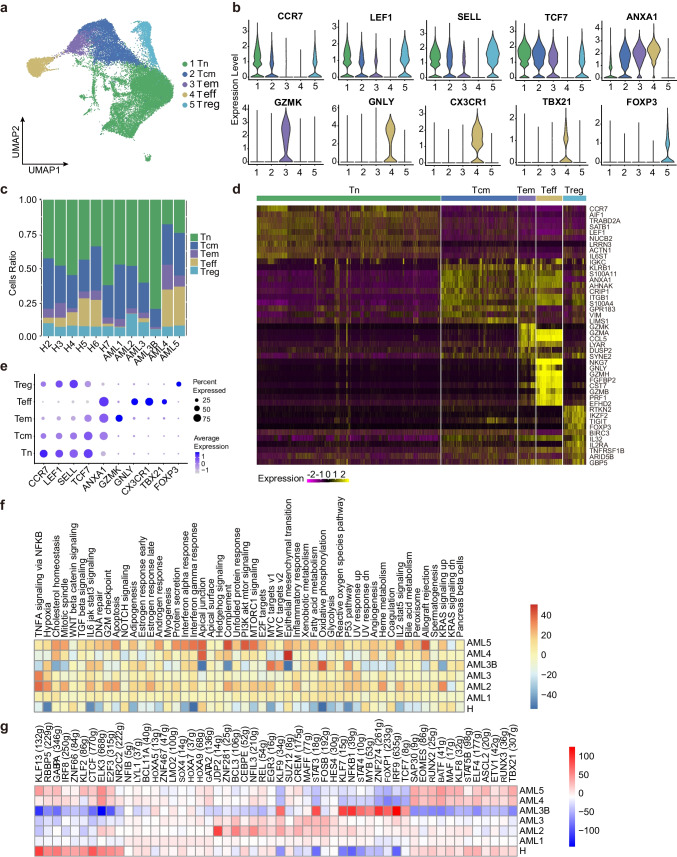
Fig. 2.
Immune landscape of CD4+ T cells in AML and healthy samples. a Five main CD4+ T cell subclusters were identified via UMAP analysis. b Violin plots show the expression levels of marker genes across the five subclusters of CD4+ T. c Proportion of five CD4+ T subsets in total CD4+ T cells in each AML patient or healthy donor. d Heatmap of gene expression and cellular cluster distribution among the five CD4+ T subclusters. e Dot plots showing the 10 signature gene expression levels across the five cellular clusters. f Heatmap of the 50 hallmark gene sets in the MSigDB database among AML patients and healthy donors of Treg cell. g Heatmap of AUCell tvalue transcription factor (TF) in CD4+ T cells among AML patients and healthy donors. Red and blue represent upregulated and downregulated TFs, respectively

