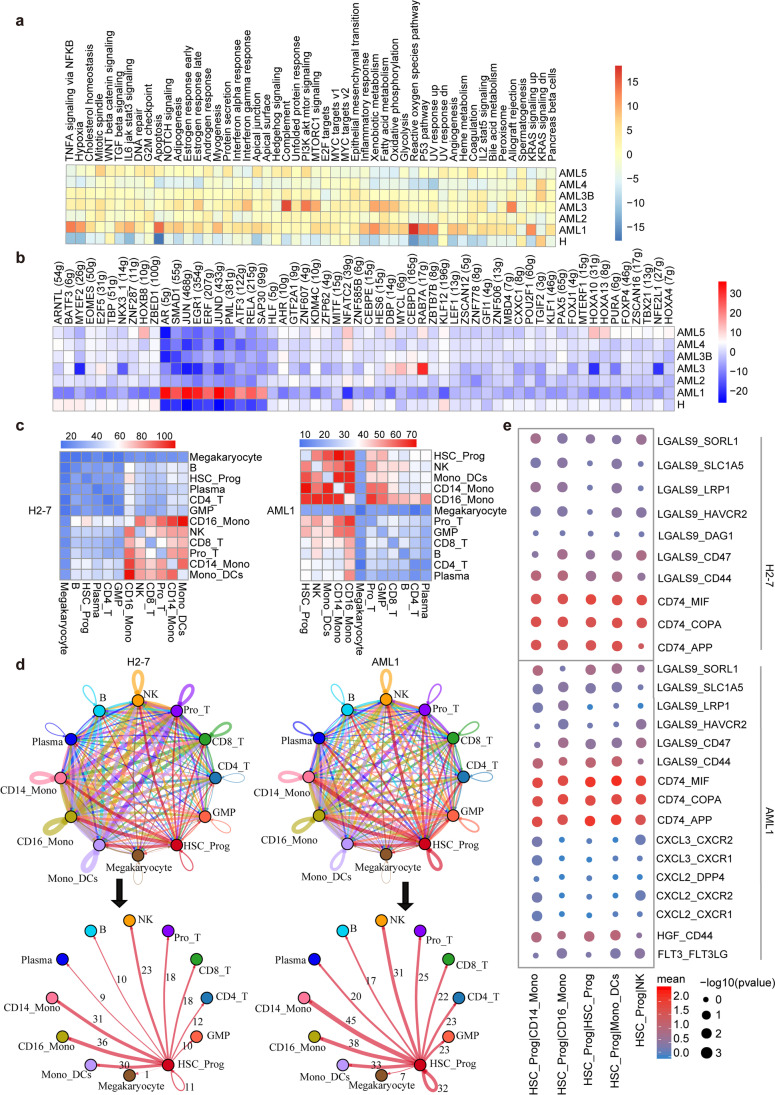
Fig. 6.
Immune landscape of HSC-Prog cells in AML and healthy samples. a Heatmap of 50 hallmark gene sets in the MSigDB database among the healthy and AML. b Heatmap of AUCell tvalue of transcription factor in HSC-Prog cells among AML patients and healthy donors. Red and blue represent upregulated and downregulated TFs, respectively. c Heatmap showing the total number of interactions between cell types in the decidua dataset obtained from CellPhoneDB. Red and blue represent a high and low number of interactions, respectively. d Connectome web analysis of lean interacting tissue-resident cell types based on the expression in the cell population. The thickness of the connecting lines is proportional to the number of interactions between two nodes. e Dot plot depicting selected cell–cell interactions between HSC-Prog and other clusters. The size of the dots represents the statistical significance of the interaction. Red and blue represent high and low marker expression levels, respectively

