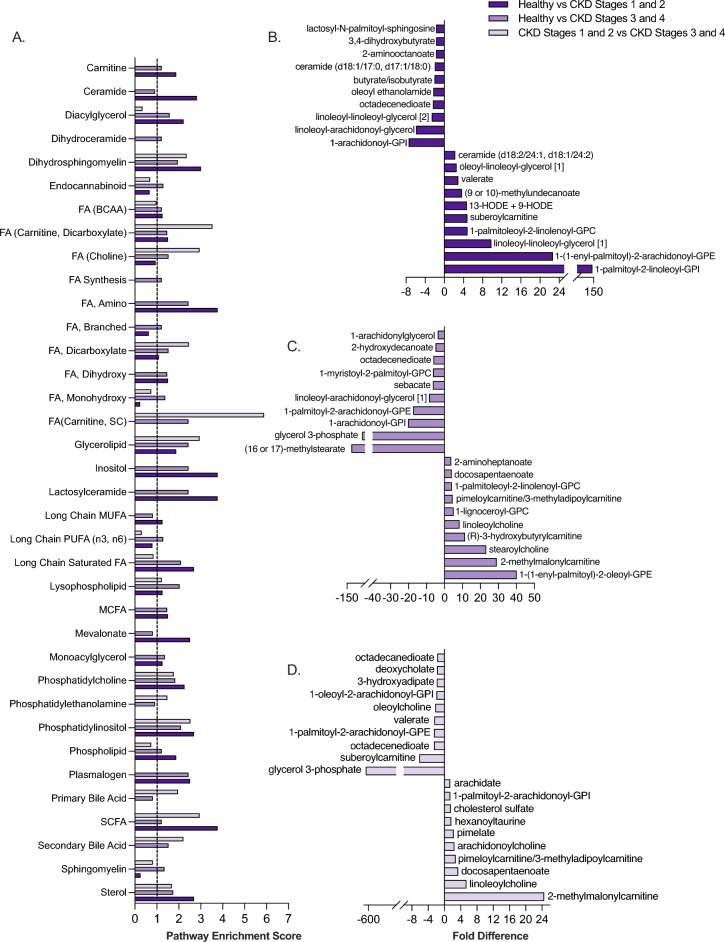
Figure 2.
Lipid metabolism is a key driver of serum metabolome differences between healthy, early-stage CKD and late-stage CKD cats. Pathway enrichment scores of lipid metabolic pathways comparing healthy cats, early-stage (Stages 1 and 2) and late-stage (Stages 3 and 4) cats (a). Dotted line at 1.0 shows metabolic pathways that were defined as meaningful contributors to patient group differences (pathway enrichment score of ≥ 1.0 in at least one patient group). Differentially abundant serum lipids with the 20 largest fold differences when comparing healthy cats versus early-stage CKD cats (b), healthy cats versus late-stage CKD cats (c) and early-stage CKD versus late-stage CKD cats (d). Significance was defined as p ≤ 0.05 following Benjamini–Hochberg adjustments to a Kruskal–Wallis test comparing normalized, scaled abundances of each metabolite across the three patient groups. BCAA Branched-chain amino acid, CKD Chronic kidney disease, FA Fatty acid, GPC glycerophosphorylcholine, GPE glycerophosphorylethanolamine, GPI glycerophosphorylinositol, HODE Hydroxyoctadecadienoic acid, MCFA Medium-chain fatty acid, MUFA Mono-unsaturated fatty acid, SC Short-chain, SCFA Short-chain fatty acid. [1] and [2] in metabolite names are used to indicate isomers.

