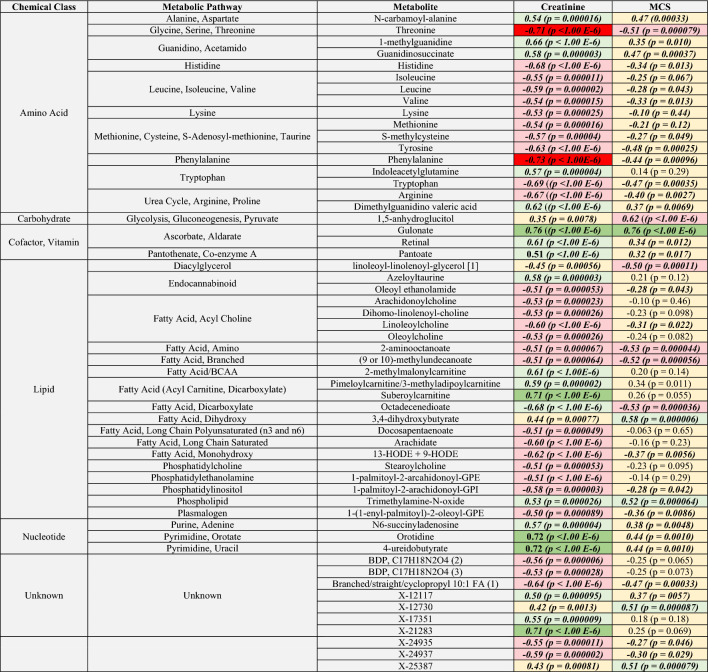
Table 4.
Correlations of selected metabolites with serum creatinine and muscle condition score.
Metabolites selected for correlation analysis included the 110 metabolites identified as key patient differentiators from heatmap + HCA, essential amino acid, and uremic toxin analyses. For each comparison, values show the correlation coefficient and p-value (parentheses) from Spearman’s correlations tests. Significance was defined as p < 0.05. Strongly correlated metabolites were defined as those that had a correlation coefficient between 0.70 and 0.89, and moderately-correlated metabolites included those with a correlation coefficient between 0.50 and 0.69. Box colors indicate the strength and direction of correlated metabolites where green shades indicate positive correlations (dark green = strongly correlated metabolites, light green = moderately-correlated metabolites), red shades indicate negative correlations (red = strongly correlated metabolites, pink = moderately-correlated metabolites), and beige boxes indicate metabolites that were weakly to poorly correlated with these variables. Bold and italics indicate metabolites that achieved statistical significance for the comparison of interest. BCAA branched-chain amino acid, BDP bilirubin degradation product, FA fatty acid, GPC glycerophosphorylcholine, GPE glycerophosphorylethanolamine, GPI glycerophosphorylinositol, HODE hydroxyoctadecadienoic acid, MCS muscle condition score.

