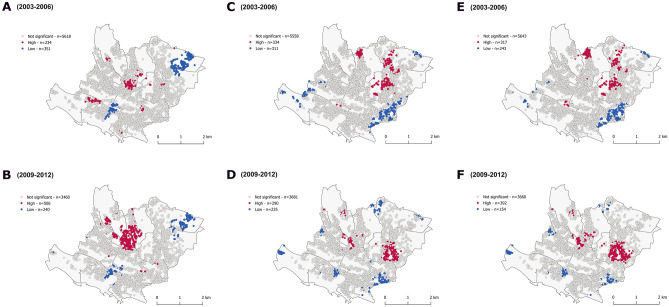
Figure 1.
Clusters of predicted risk (A,B), 10-year observed cardiovascular diseases (C,D) and mean squared errors of prediction (E,F). Getis-Ord Gi* statistic for the individuals geo-referenced at their postal address. White dots correspond to individual with values that do not exhibit spatial dependence. Red/Blue dots indicate individuals with a positive/negative Z score considering a p value < 0.05 (α = 0.05). This means that high or low values clusters, respectively, within a spatial lag of 600 m, are found closer together than expected if the underlying spatial process was random.

