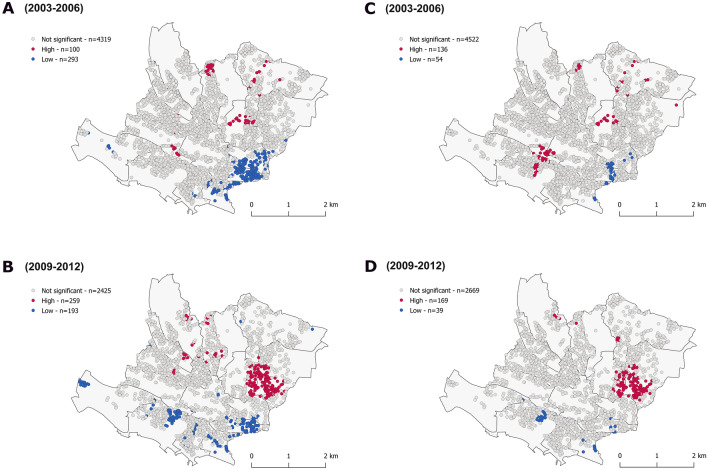
Figure 4.
Clusters of 10-year observed cardiovascular diseases unadjusted (A,B) and multivariable adjusted (C,D). Getis-Ord Gi* statistic for the individuals geo-referenced at their postal address. White dots correspond to individual with values that do not exhibit spatial dependence. Red/Blue dots indicate individuals with a positive/negative Z score considering a p value < 0.05 (α = 0.05). This means that high or low values clusters, respectively, within a spatial lag of 600 m, are found closer together than expected if the underlying spatial process was random. The multivariable model (GWR) included age, comorbidity, lipid modifying and antihypertensive drug, body mass index, alcohol consumption, living in couple, low education status, Townsend index, Swiss origin, anxiety and major depressive disorder, the predicted risk with age fixed and at follow-up 1 a Mediterranean diet score, and daily moderate intensity activity. Additional models accounting for a polygenic risk score, with similar results, are shown within the supplementary figure S14, 18.

