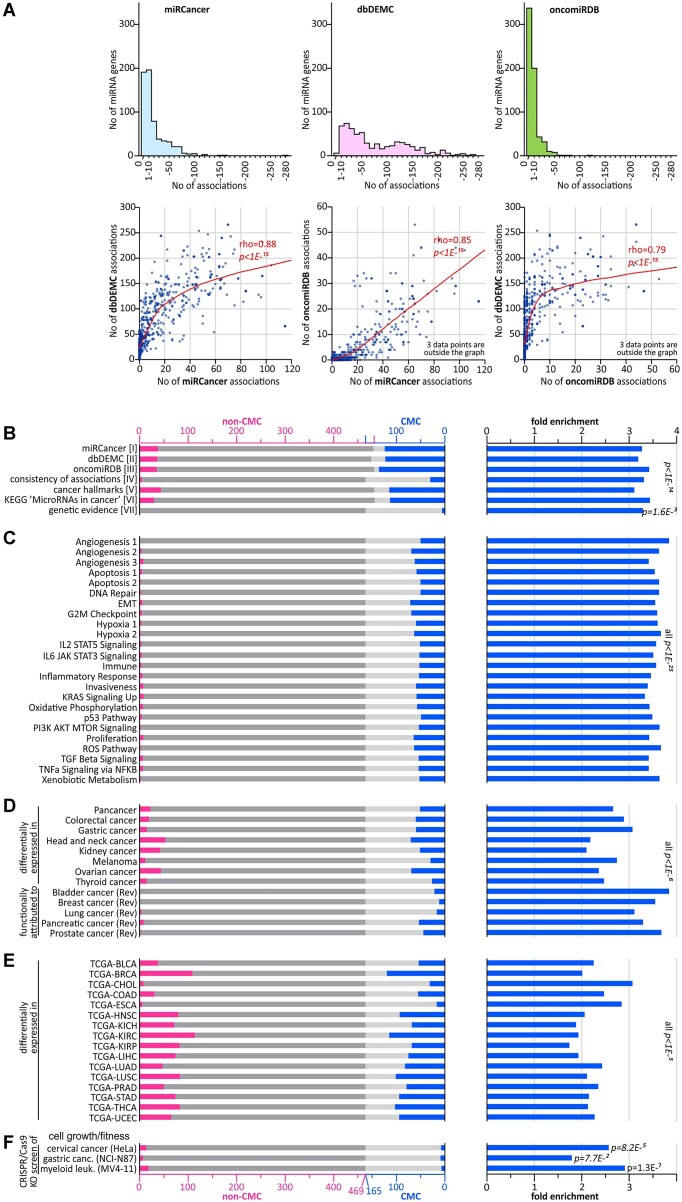
Figure 3.
Characterization of CMC selection criteria and validation of CMC miRNA genes. (A) Characteristics of miRNA–cancer association data extracted from the miRCancer, dbDEMC and oncomiRDB databases [criteria I-III]. The histograms above show the distribution of the number of miRNA-cancer associations recorded in each of the databases. The bars in each of the graphs represent the number of miRNA genes (y-axis) with the following numbers of associations: 0, 1–10, 11–20, etc. (x-axis). Scatterplots below show the pairwise correlation analysis of numbers of miRNA-cancer associations attributed to particular miRNA genes (represented by the dots) in the three databases (indicated along the axes). Local regression smoothing trendline and Spearman's rank correlation coefficient (rho) are shown in red. (B) Results of the leave-one-out analysis of criteria I-VII. The graph [on the left] shows the occurrence of miRNA genes scored by particular criteria in non-CMC (pink bars on dark gray background) and CMC miRNA genes (blue bars on light gray background). The graph [on the right] shows FE values of miRNA genes annotated by particular criteria in a group of CMC miRNA genes (compared to expected by chance). Note that groups of miRNA annotated as CMC and non-CMC slightly differ between evaluated criteria due to the withdrawal of particular criteria from CMC scoring in the leave-one-out analysis and selection of new CMC group (see the leave-one-out procedure in Materials and Methods). (C–F) The occurrence and FE values of miRNA genes associated with 24 individual cancer hallmarks (C), identified as differentially expressed (in research articles) or recognized as playing a role in different cancer types (in review articles) (D), differentially expressed in 16 tumor types analyzed in TCGA (from OncomiR; the TCGA cancer-type abbreviations are explained in Supplementary Table S5) (E), and miRNA genes identified in CRISPR-based knock-out screenings as impacting cell growth/fitness (52,53) (F). The graphs scheme is as in (B).

