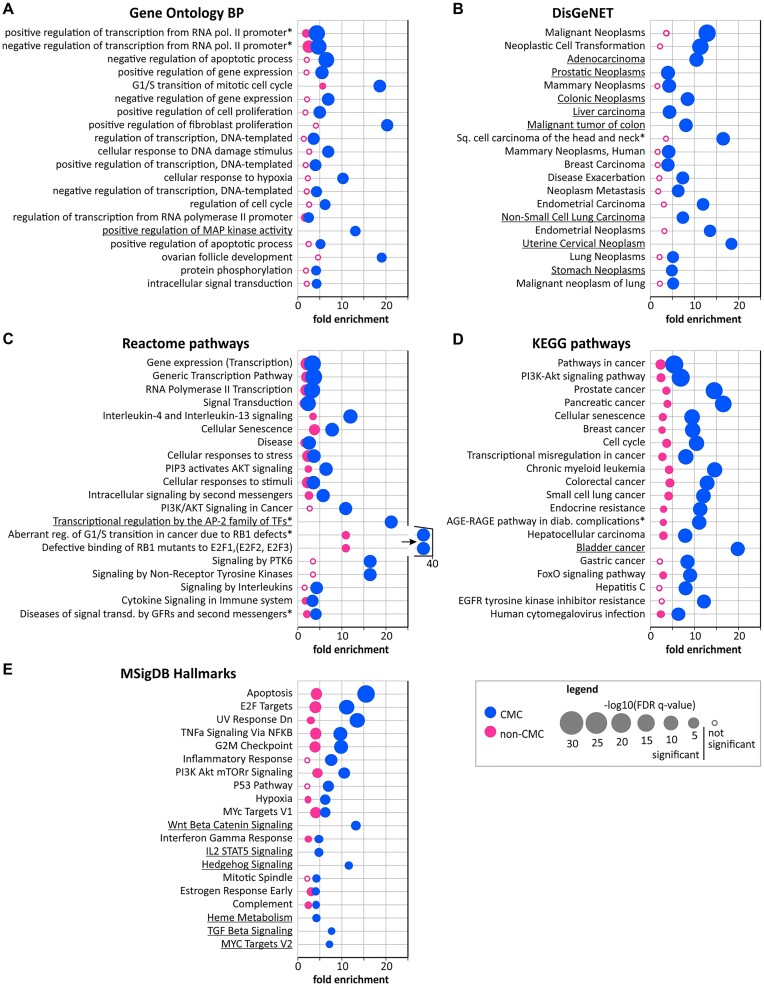
Figure 4.
Association of CMC and non-CMC target genes with different functional categories. (A–E) Bubble plots illustrating FE of CMC (blue bubbles) and non-CMC (pink bubbles) target genes in gene categories defined by Gene Ontology BP terms (A), DisGeNET-associated diseases (B), Reactome pathways (C), KEGG pathways (D) and MSigDB hallmarks (E). Bubble sizes are proportional to –log10(q-values) (see legend). Each plot shows 20 representative categories associated with CMC miRNA gene targets with the lowest q-values. Full lists of associated categories are shown in Supplementary Table S8. Asterisk indicates terms with shortened names presented on the plot; for underlined terms no enrichment was indicated in non-CMC.

