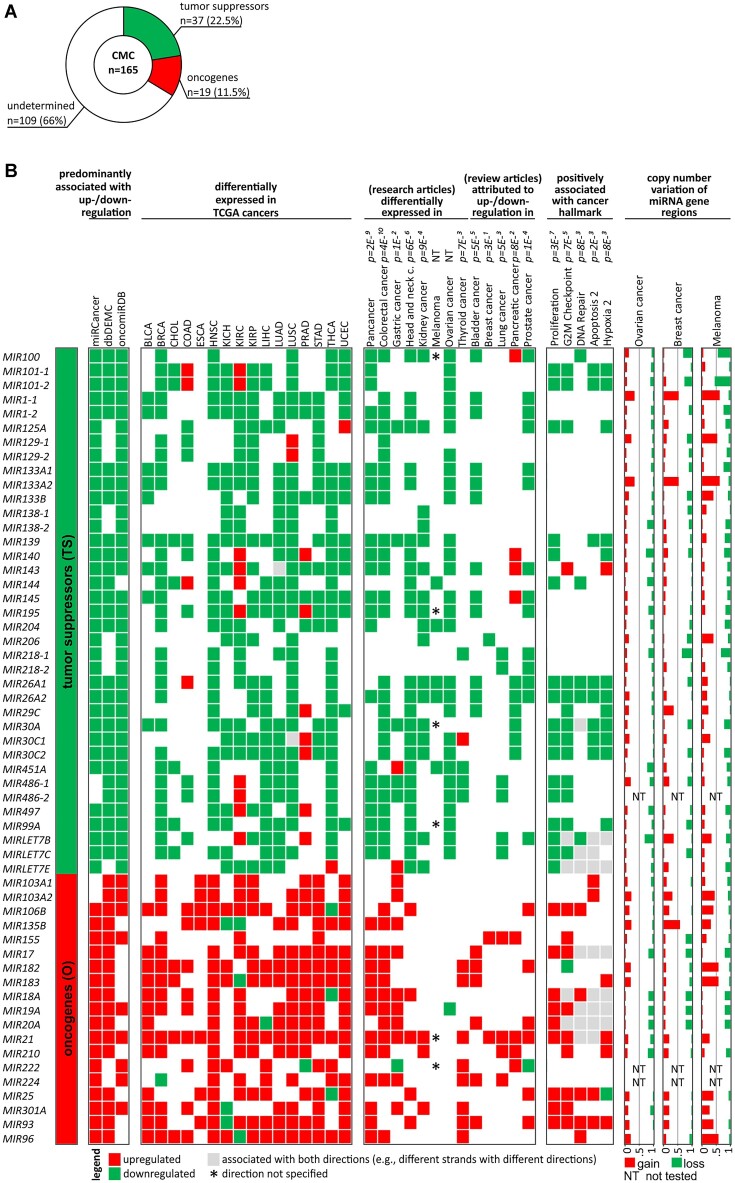
Figure 5.
miRNA genes assigned as potential tumor suppressors or potential oncogenes. (A) Proportion (number and percent) of miRNA genes assigned as tumor suppressors, oncogenes, and unassigned to any category (undetermined) out of all (n165) CMC miRNA genes. (B) List of potential tumor suppressor and oncogene miRNA genes with their characteristics. From the left: list of miRNA genes; heatmap showing the predominant direction of associations (≥75%) with either decreased level/tumor suppressor properties (green) or increased level/oncogenic properties (red) reported in the miRCancer, dbDEMC, and oncomiRDB databases (indicated above); heatmap showing significant expression level changes in 16 cancer types analyzed in TCGA (based on OncomiR; standard TCGA cancer type abbreviations are indicated above); heatmap showing expression level changes in different cancer types (indicated above) as specified in research and review articles used before for validation of CMC; heat map indicating associations with cancer hallmarks (indicated above; according to (36)) positively associated with the suppressor/oncogene status of miRNA genes; graphs showing the proportion of gains and losses in genomic regions encompassing miRNA genes in three cancer types (specified above; according to (66)).

