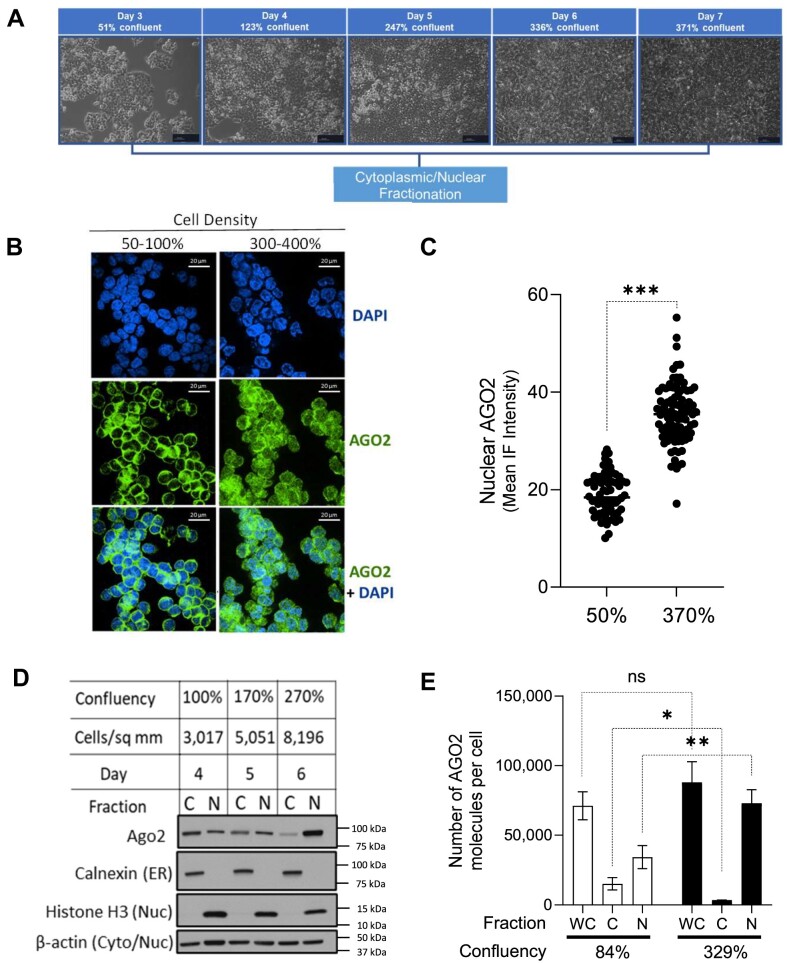
Figure 1.
AGO2 shifts localization to the nucleus in cells grown to high density. (A) Microscopy images (0.25X magnification) taken immediately before harvesting each time point of increasing cell density stress. Average confluency calculated based on cell count and available surface area for growth. (B) Immunofluorescence of AGO2 (green) localization and DAPI staining of nuclei (blue) at low confluency (80–100%) and high confluency (300–400%). (C) Quantification of nuclear localization of AGO2 by mean immunofluorescence intensity. Unpaired t-test, two-tailed used to calculate P-value < 0.0001. (D) Western blot showing AGO2 localization and purity of cytoplasmic (C) and nuclear (N) fractions (N = 3). (E) Estimates of absolute copy per cell of AGO2 in whole cell (WC), cytoplasm (C), and nuclear (N) fractions determined by Western blot comparing densitometry of a serial dilution of recombinant AGO2 compared to signal from fractionated lysate. Unpaired t-test with Welch's correction to calculate significance of the change in cytoplasm P= 0.04 and nucleus P= 0.006.

