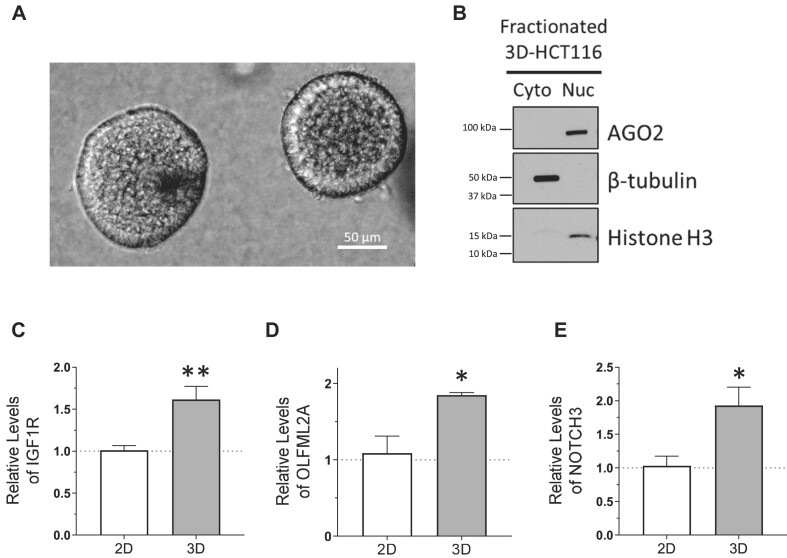
Figure 10.
AGO2 is enriched in the nucleus in 3D-cultured tumor spheroids. (A) Microscopy images of 3D-cultured HCT116 tumor spheroids. (B) Western blot showing AGO2 localization in 3D-HCT116 (N = 3). (C–E) Relative mRNA expression of candidate miRISC targets in 3D cultured HCT116 relative to parental 2D-cultured HCT116 cell line used to seed 3D culture. Significance denoted with *’s: (C) IGF1R, P= 0.0016, (D) OLFML2A, P= 0.036, (E) NOTCH3, P= 0.025.

