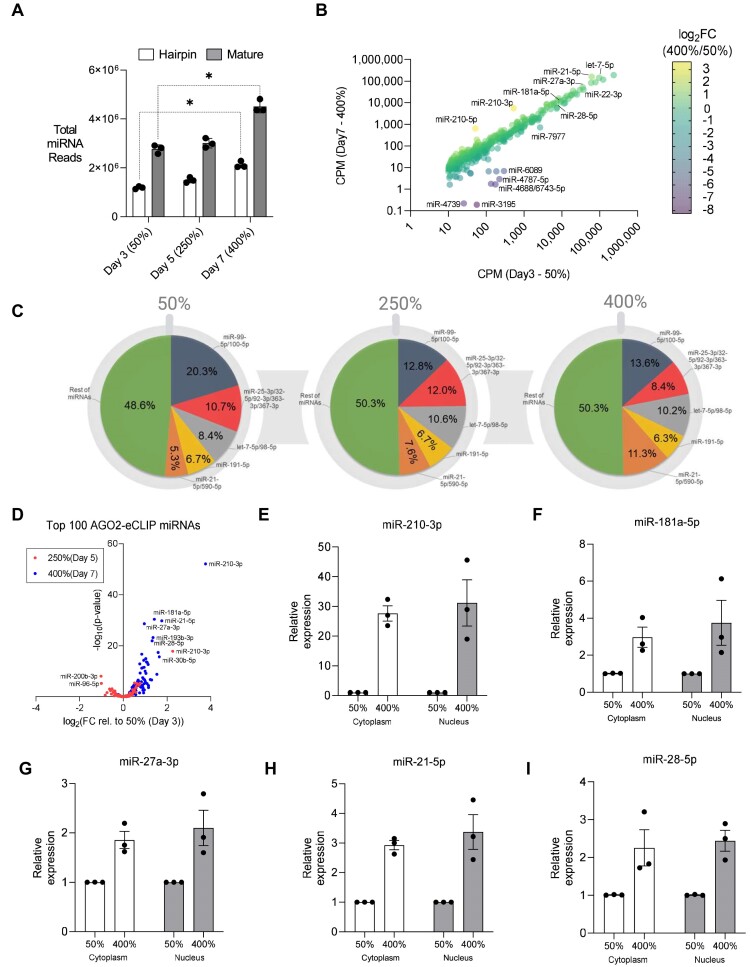
Figure 4.
Global Increase in miRNA Expression at High Cell Density. (A) Global miRNA expression from small-RNA-seq (CPM). Paired t-test used to calculate significance with hairpin reads on day 7 relative to day 3 as P= 0.012 and mature reads on day 7 relative to day 3 as P= 0.019. (B) Total miRNA reads aligning to hairpin sequences and mature sequences. (C) miRNA expression from small-RNA-seq based on families sharing seed sequence at 50%, 250%, and 400% confluency. (D) Volcano plot showing significance and fold-change of the expression of the top 100 AGO2-eCLIP miRNAs at 250% confluency relative to 50% confluency (light blue) and at 400% confluency relative to 50% confluency (dark blue). (E-I) miRNA with greatest expression change in (D) measured by RT-qPCR in RNA isolated from cytoplasm and nuclear fractions at 50% and 400% confluency.

