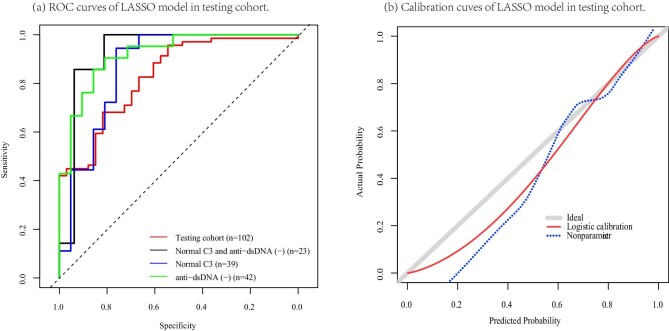
Figure 3:
Validation of the LASSO model in the testing cohort. (a) ROC curves. Subgroup analysis: the discrimination of the LASSO model in the testing cohort of patients with normal C3 concentration and/or anti-dsDNA seronegative. (b) Calibration curves. Grey line: nomogram AI = observed AI; blue line: actual calibration; red line: adjusted curves with bootstrapping samples (1000 repetitions).

