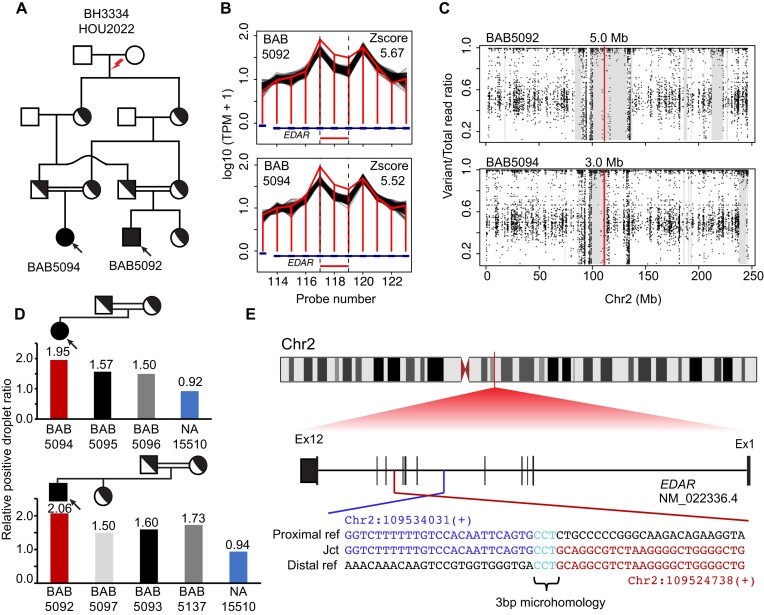
Figure 3.
De novo ancestral pathogenic duplication CNV in clan and identity-by-descent (IBD). (A) Pedigree of the family HOU2022 with standard pedigree symbols used; historical evidence of consanguinity depicted by horizontal double black lines. (B) Homozygous duplication observed at EDAR locus with an apparent read count change demarcated by normalized read depth plot (horizontal jagged red line) in the proband BAB5092 and affected brother BAB5094 and comparison controls (black horizontal lines) of nearest reference samples. The red rectangle shows the predicted homozygous duplicated region. (C) Scatter plot displays the predicted AOH region of proband BAB5092 and affected brother BAB5094; the vertical line in red indicates the center point of homozygous duplication allele and grey rectangle denotes the AOH region. (D) Segregation of homozygous duplication confirmed by ddPCR; red vertical bar showing homozygous exonic duplication CNV whilst heterozygous father (black), heterozygous mother (grey) and control normal diploid copy number (blue) are shown. The relative droplet ratio of two is consistent with homozygous duplication. (E) Breakpoint junction sequence aligned with the distal (red) and proximal reference sequence (blue), revealing the 3 bp microhomology (teal) at the breakpoint junction.

