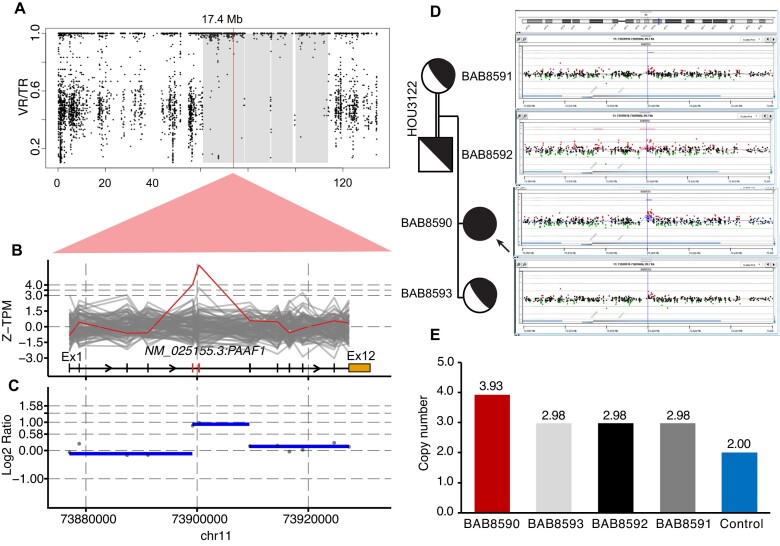
Figure 5.
Homozygous exonic duplication of PAAF1. (A–C) AOH plot and Z-TPM and log2 ratio visualization indicate homozygous intragenic duplication in proband BAB8590. (D) aCGH confirms the segregation of the duplication in unaffected family members. (E) Segregation of HMZ duplication supported by probe-based ddPCR.

