Figure 6.
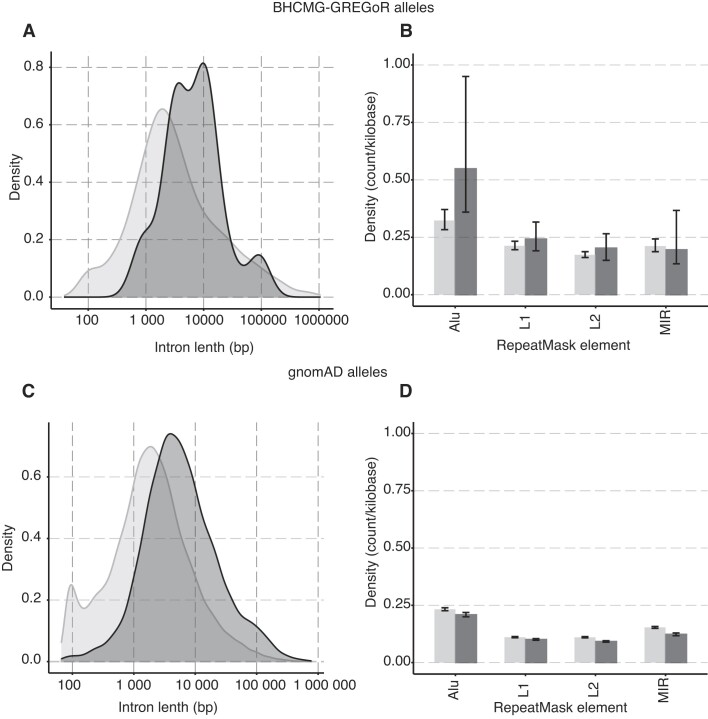
The genomic features of exonic CNVs. The dark grey color denotes the intron associated with an exonic CNVs breakpoint, while the light grey signifies the introns that do not associate with a breakpoint. (A) The curves display the distribution of intron lengths for BHCMG-GREGoR CNV alleles. Breakpoint locations for exonic CNV alleles (n = 15) were extracted from both this report and previous publications (2,11). (B) The bar graph shows the density of repetitive element count per kilobase within an intron (n = 516) involved in BHCMG-GREGoR CNV alleles. The color denotes the group of introns: dark grey represents the introns that have a breakpoint mapped, and light grey represents the rest of the introns. (C) The curves display the distribution of intron lengths for gnomAD SVs v2.1 CNV alleles. (D) The bar graph shows the density of repetitive element count per kilobase within an intron (n = 22,888) involved in gnomAD SVs v2.1 CNV alleles.

